Fig. 11.
Download original image
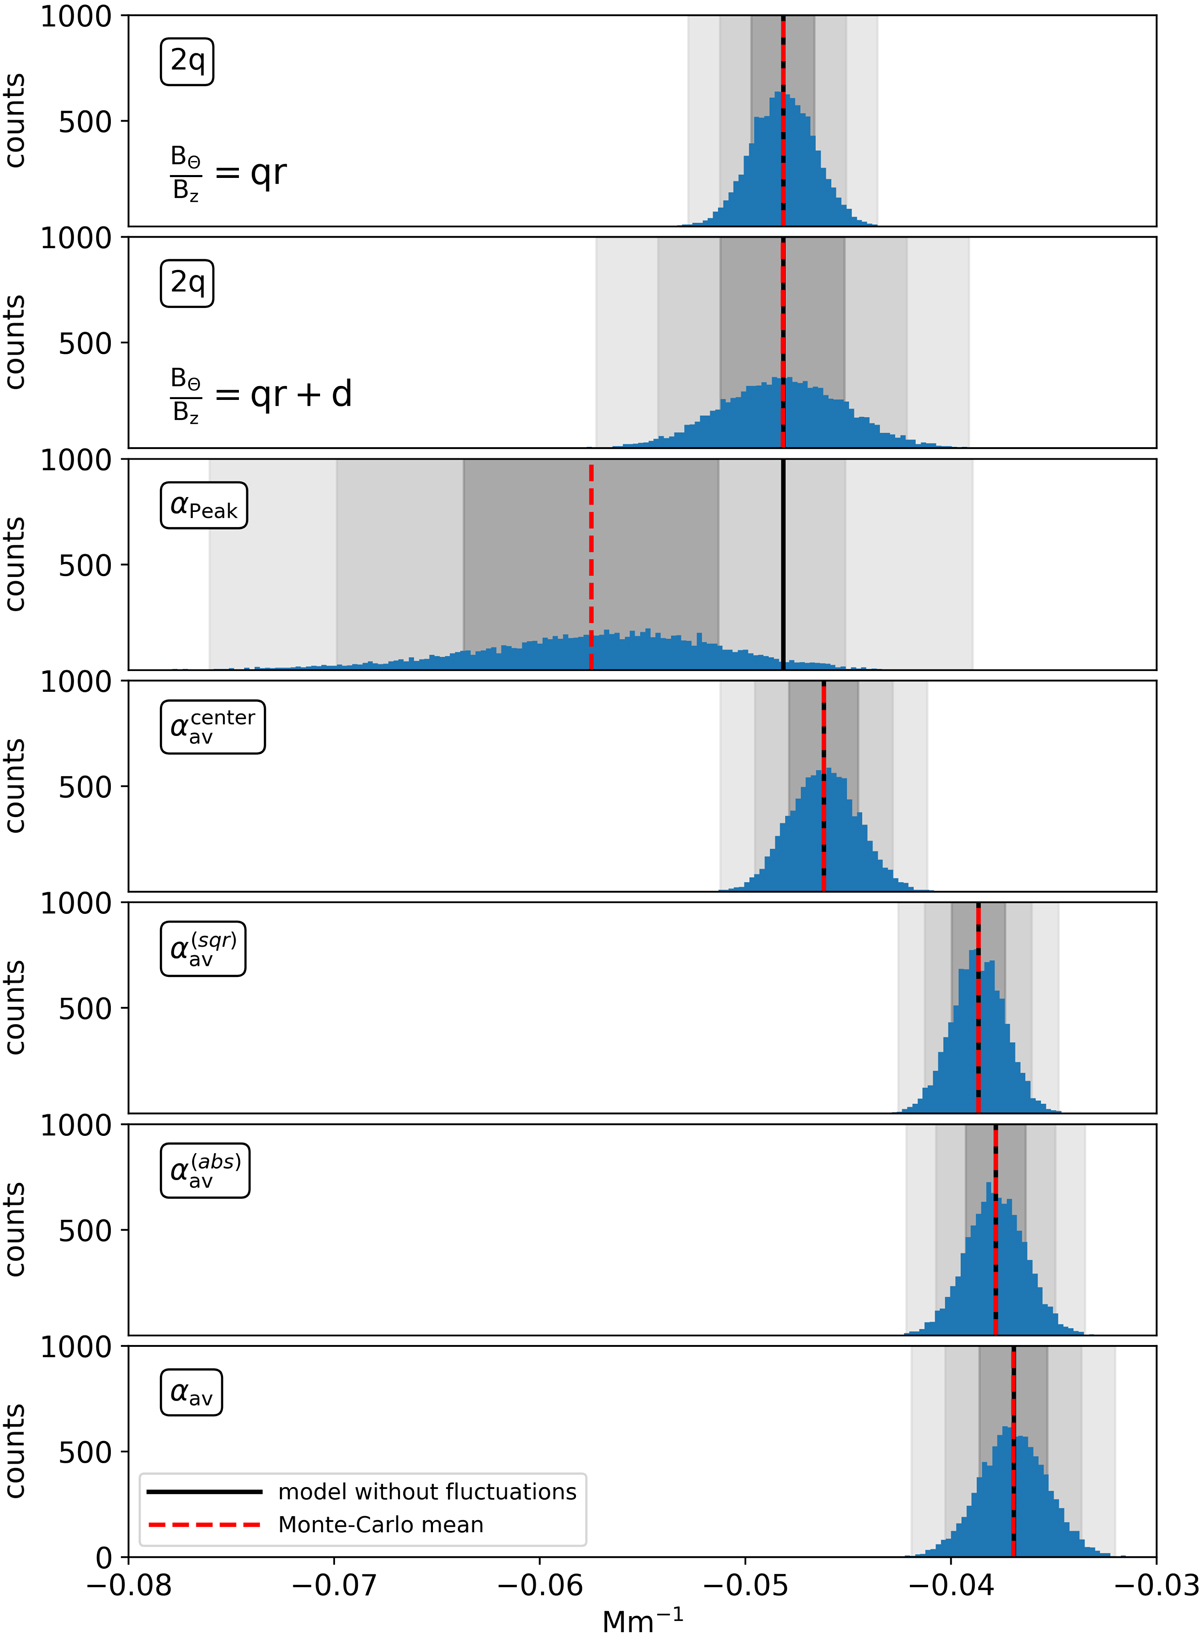
Monte-Carlo simulation results for methods described in Sect. 5. The q values have been multiplied by two in order to make them directly comparable to αz (see Appendix F). The black line indicates the reference value of the model, which is expected from the model without any fluctuations. The red dashed line shows the mean value from the Monte-Carlo simulations. The gray shaded areas represent the range of 1, 2, and 3σ around the Monte-Carlo mean.
Current usage metrics show cumulative count of Article Views (full-text article views including HTML views, PDF and ePub downloads, according to the available data) and Abstracts Views on Vision4Press platform.
Data correspond to usage on the plateform after 2015. The current usage metrics is available 48-96 hours after online publication and is updated daily on week days.
Initial download of the metrics may take a while.