Fig. 10.
Download original image
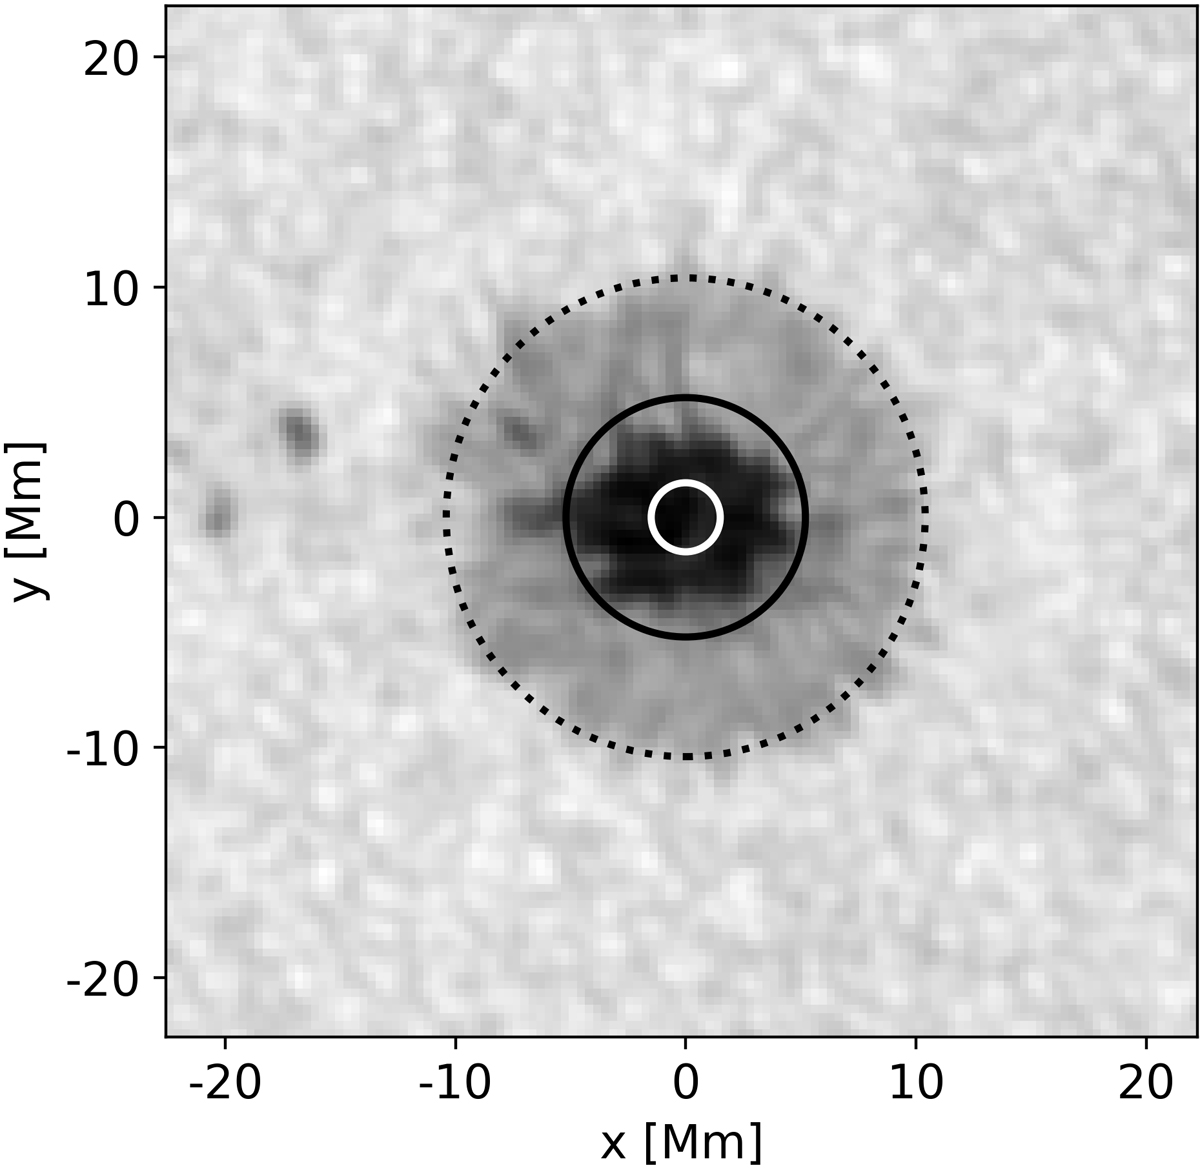
HMI continuum image of the leading sunspot of active region NOAA 11072 (2010.05.25 03:00:00 TAI), which was used as a reference for the model presented in this work. The black solid line outlines the umbral area that was considered for most twist calculation methods. The white solid line and the black dotted line correspond to the areas that were used to get spatial averages of αz close to the center of the spot (![]() ) and over the whole spot (
) and over the whole spot (![]() ), respectively.
), respectively.
Current usage metrics show cumulative count of Article Views (full-text article views including HTML views, PDF and ePub downloads, according to the available data) and Abstracts Views on Vision4Press platform.
Data correspond to usage on the plateform after 2015. The current usage metrics is available 48-96 hours after online publication and is updated daily on week days.
Initial download of the metrics may take a while.