Fig. 9
Download original image
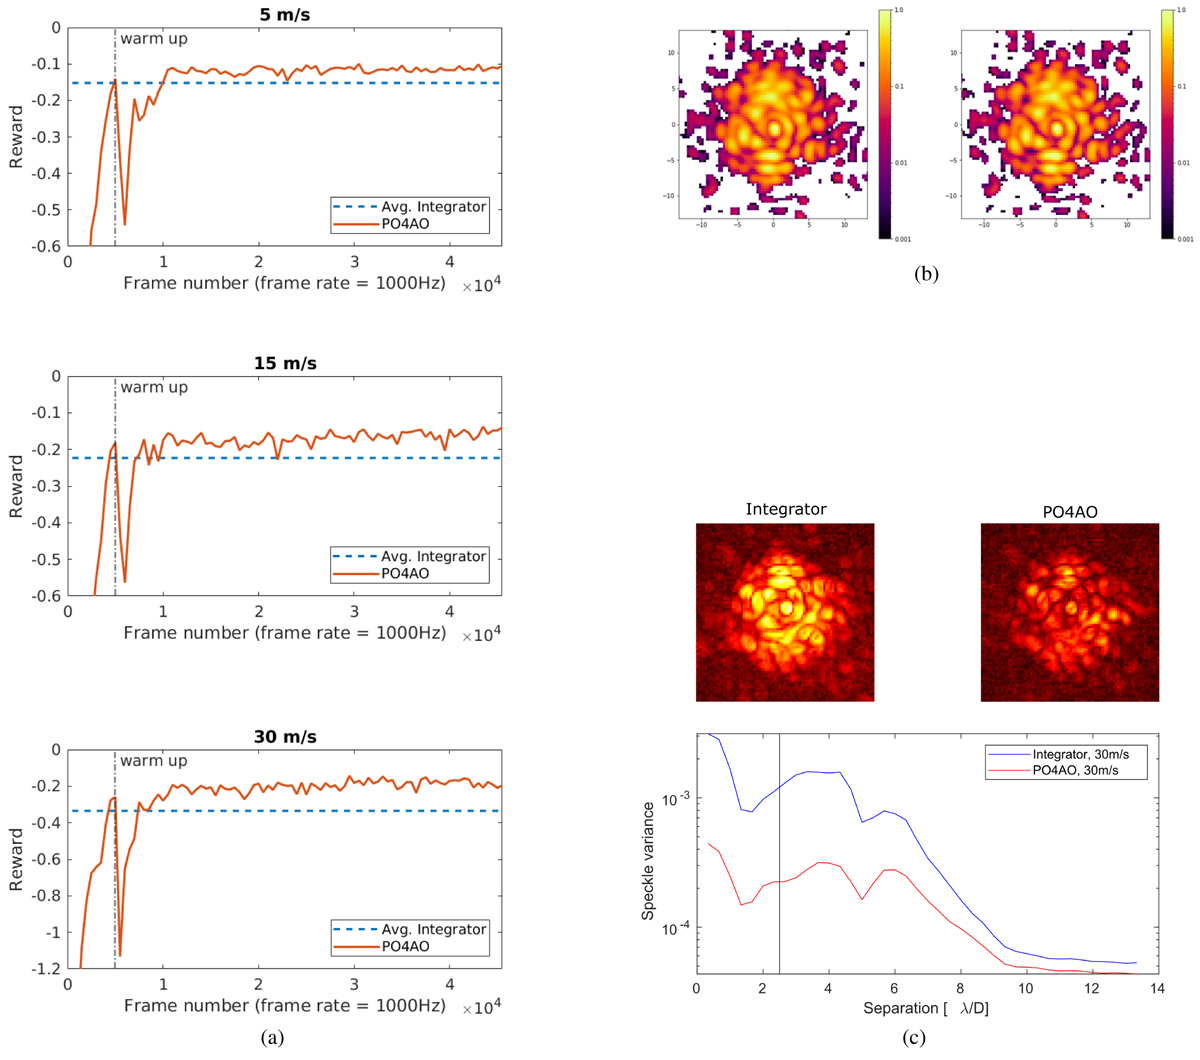
MagAO-X experiment results. Panel a: training curves for PO4AO in the lab setup. The red lines are for PO4AO performance and dashed blue line represents the average integrator performance over an episode. The dashed gray vertical line is where the policy is switch from noisy integrator to PO4AO. For all different wind conditions the PO4AO passes the integrator performance after 10 k frames of data. Panel b: MagAO-X post-coronagraphic PSFs of the methods. Left is for the Integrator and right for the PO4AO. The PSFs are limited by NCPA and, in order to validate the method, we examined the temporal variance of the PSFs (see panel c). Panel c: temporal variance of MagAO-X post-coronagraphic PSFs. Upper images: temporal speckle variance at image plane for both control methods (left: integrator, right: PO4AO). Lower image: radial average over the images. The blue line is for the integrator and the red line for the PO4AO. The gray vertical line represents the inner working angle of the coronagraph (radius 2.5λ/D).
Current usage metrics show cumulative count of Article Views (full-text article views including HTML views, PDF and ePub downloads, according to the available data) and Abstracts Views on Vision4Press platform.
Data correspond to usage on the plateform after 2015. The current usage metrics is available 48-96 hours after online publication and is updated daily on week days.
Initial download of the metrics may take a while.