Fig. 7
Download original image
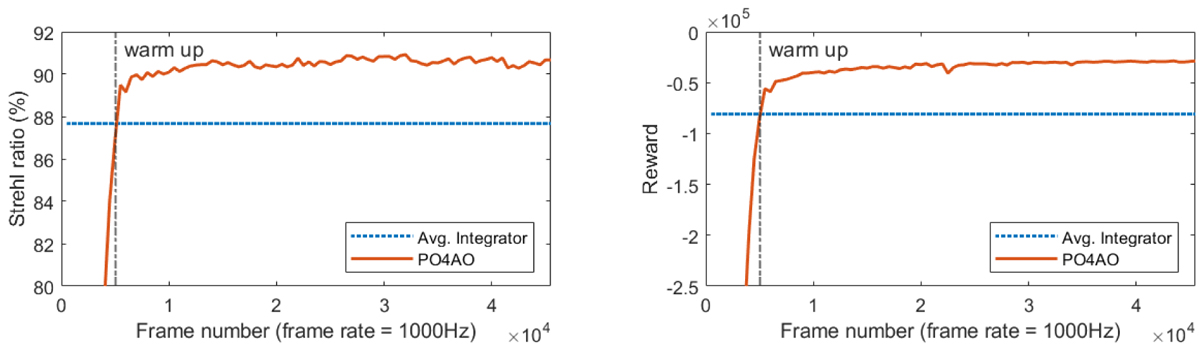
Training plots for the 40-m telescope experiment. The red lines correspond to performance of the PO4AO during each episode and blue lines for the average integrator performance. The gray dashed line marks the end of integrator warm up for PO4AO. Similarly to 8-meter telescope experiments the PO4AO outperforms the integrator after the warm up.
Current usage metrics show cumulative count of Article Views (full-text article views including HTML views, PDF and ePub downloads, according to the available data) and Abstracts Views on Vision4Press platform.
Data correspond to usage on the plateform after 2015. The current usage metrics is available 48-96 hours after online publication and is updated daily on week days.
Initial download of the metrics may take a while.