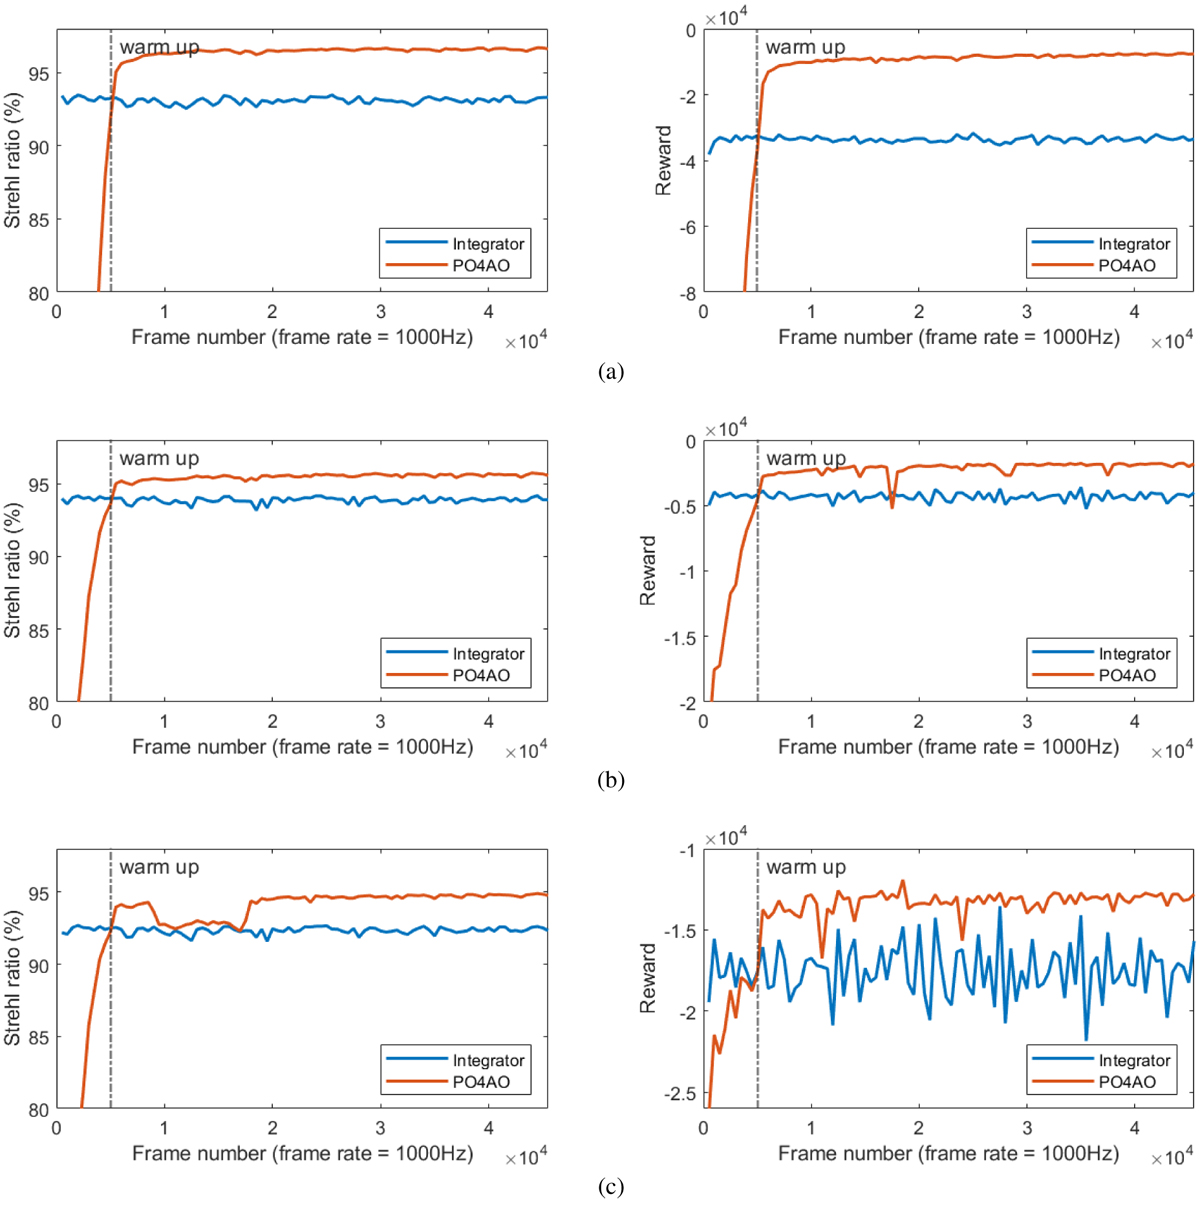
Fig. 6
Download original image
Training plots for 8-meter telescope experiments. Panel a: for ideal wavefront sensor, panel b is for the 0th magnitude guide star, and panel c for the 9th magnitude guide star. The red lines correspond to performance of PO4AO during each episode and blue lines for the integrator. The gray dashed line marks the end of integrator warm up for PO4AO. In all cases the PO4AO outperforms the integrator all ready after the warm up period, in both the Strehl ratio and rewards. An optimized implementation of the PO4AO could run the training in parallel to control, and the training time would then be included in the plot (see Sect. 6.2).
Current usage metrics show cumulative count of Article Views (full-text article views including HTML views, PDF and ePub downloads, according to the available data) and Abstracts Views on Vision4Press platform.
Data correspond to usage on the plateform after 2015. The current usage metrics is available 48-96 hours after online publication and is updated daily on week days.
Initial download of the metrics may take a while.