Open Access
Fig. 8
Download original image
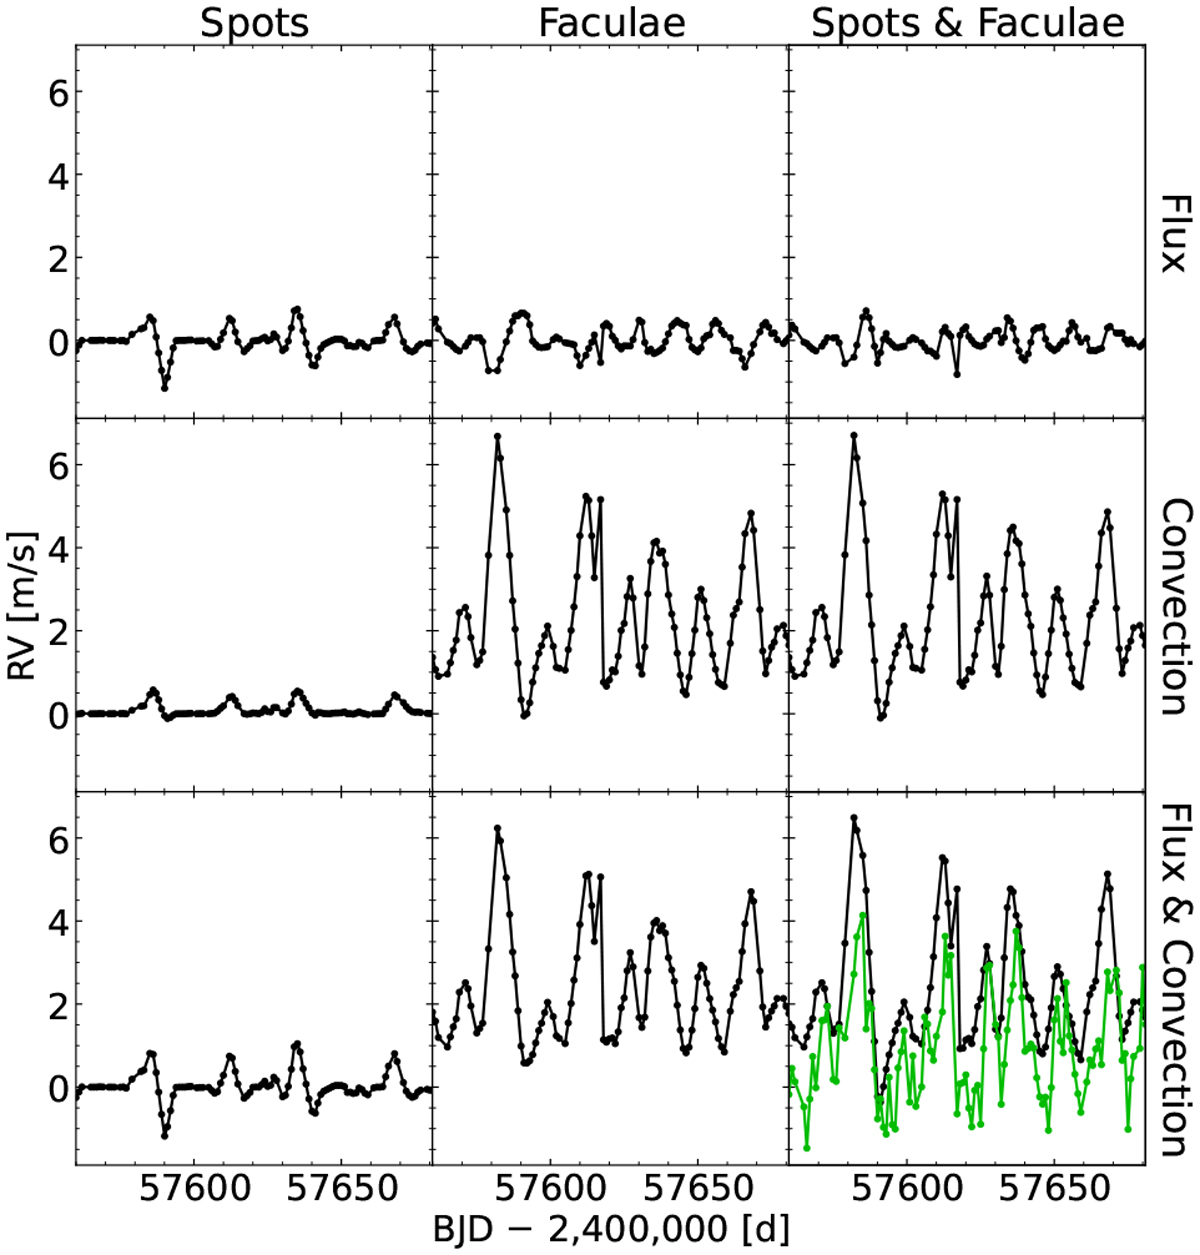
SOAP–GPU generated RVs for the same time points as in Fig. 6, separated into active regions (spots, faculae, and both) and effects (flux, convection, and both). The green curve in the lower right panel is the observed RVs without temperature binning.
Current usage metrics show cumulative count of Article Views (full-text article views including HTML views, PDF and ePub downloads, according to the available data) and Abstracts Views on Vision4Press platform.
Data correspond to usage on the plateform after 2015. The current usage metrics is available 48-96 hours after online publication and is updated daily on week days.
Initial download of the metrics may take a while.