Fig. 6
Download original image
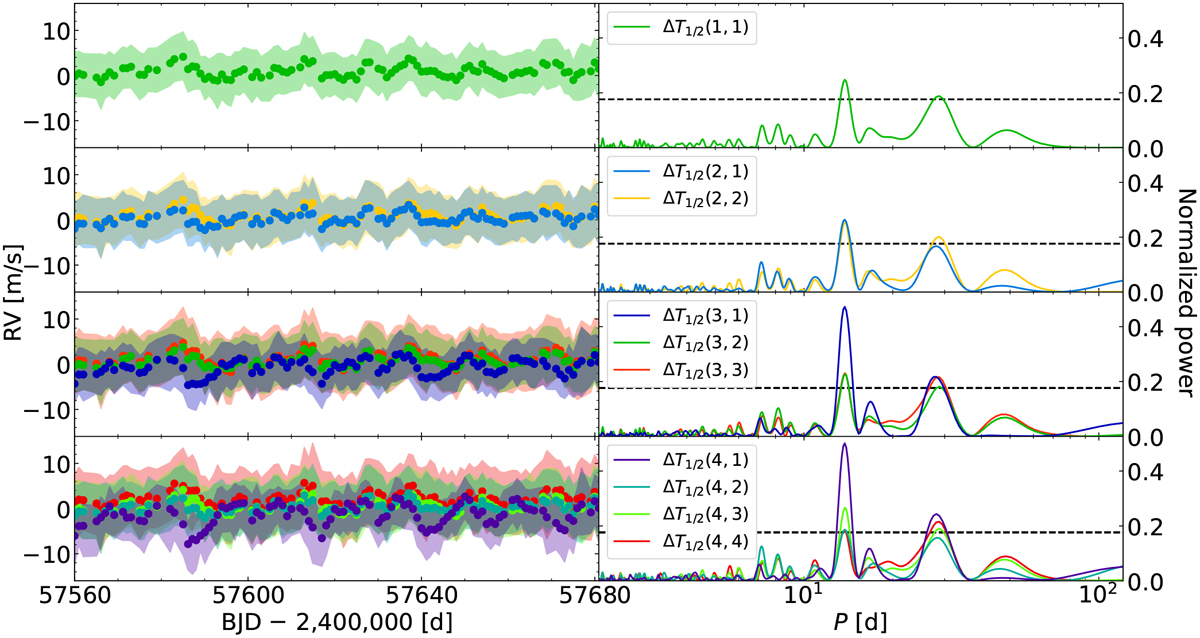
Solar short-term RVs. Left: time series for one to four temperature bins. Each point is the weighted average of all spectral lines with RV values for a given bin. The shaded intervals represent the 16th to 84th percentile of all RVs at any given time point. Times are given in Barycentric Julian Date (BJD). Right: GLS periodograms of the time series shown in the left panels. The legend displays the temperature bin symbol (see main text and Table 2 for the definition). The dashed line indicates the 1% FAP level.
Current usage metrics show cumulative count of Article Views (full-text article views including HTML views, PDF and ePub downloads, according to the available data) and Abstracts Views on Vision4Press platform.
Data correspond to usage on the plateform after 2015. The current usage metrics is available 48-96 hours after online publication and is updated daily on week days.
Initial download of the metrics may take a while.