Fig. 4
Download original image
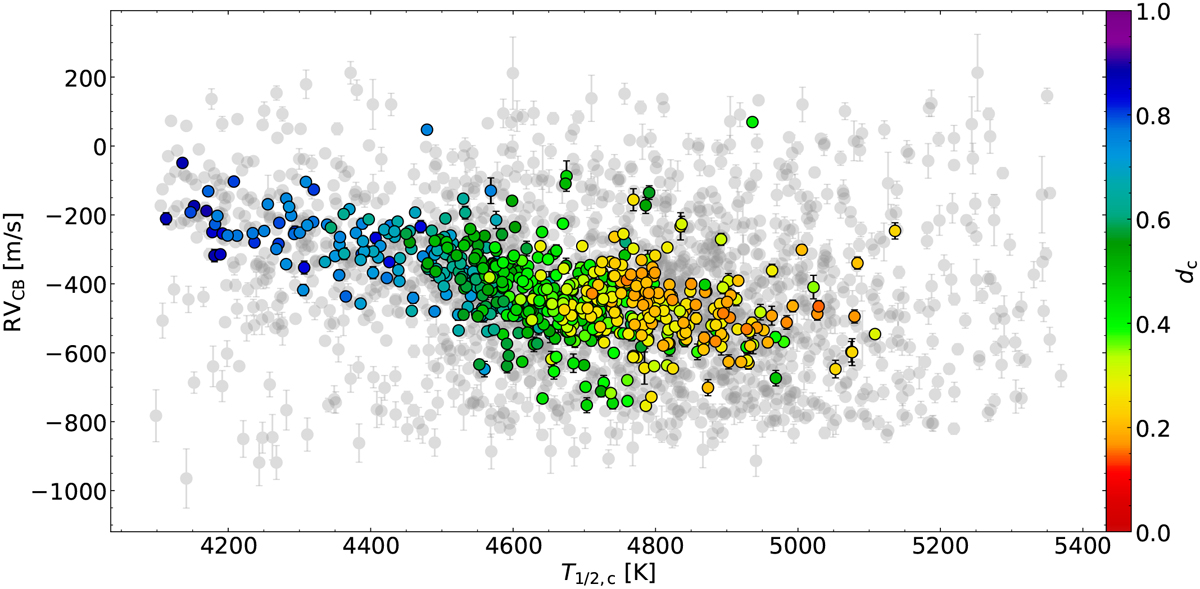
Solar convective blueshift as a function of T1/2 at the line cores. Only lines that could be cross-matched with the VALD3 line list are displayed. The markers of lines from the final selection are color-coded, and the line depth is shown in the color bar. The other lines are shown in gray. The gravitational redshift of RVgrav= GM/Rc, where M and R are the solar mass and radius, has been subtracted.
Current usage metrics show cumulative count of Article Views (full-text article views including HTML views, PDF and ePub downloads, according to the available data) and Abstracts Views on Vision4Press platform.
Data correspond to usage on the plateform after 2015. The current usage metrics is available 48-96 hours after online publication and is updated daily on week days.
Initial download of the metrics may take a while.