Fig. A.1
Download original image
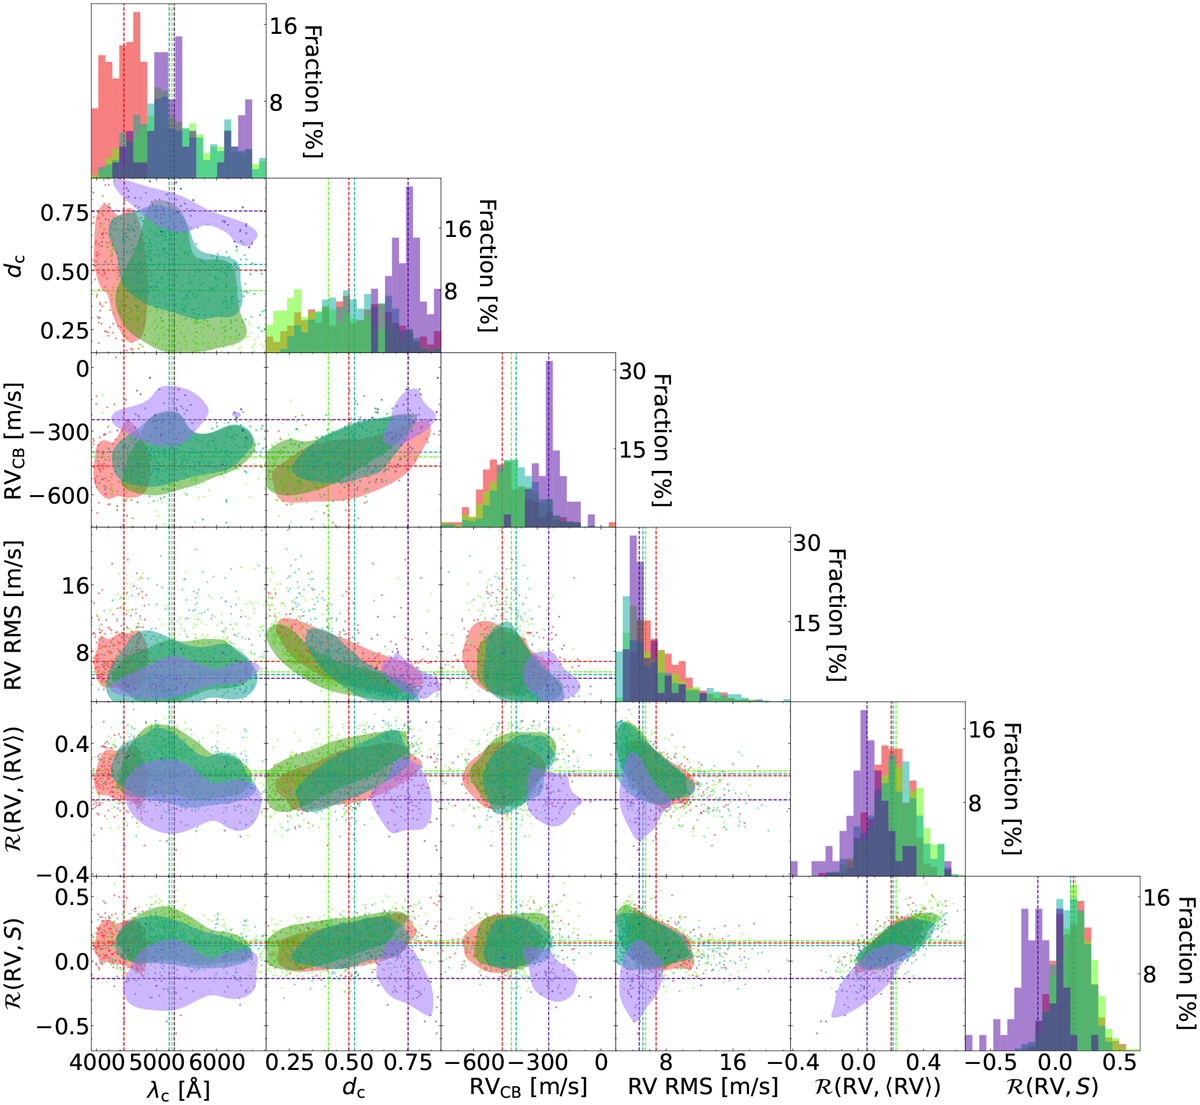
Corner plot of various line parameters of the Sun for four temperature bins. From left to right, we show the central wavelength, line depth, convective blueshift, the correlation between LBL RV and mean RV, and the correlation between LBL RV and S index. The dashed lines and contours indicate the medians and the ±1σ kernel densities, respectively. The color-coding is the same as in Fig. 6.
Current usage metrics show cumulative count of Article Views (full-text article views including HTML views, PDF and ePub downloads, according to the available data) and Abstracts Views on Vision4Press platform.
Data correspond to usage on the plateform after 2015. The current usage metrics is available 48-96 hours after online publication and is updated daily on week days.
Initial download of the metrics may take a while.