Fig. 10
Download original image
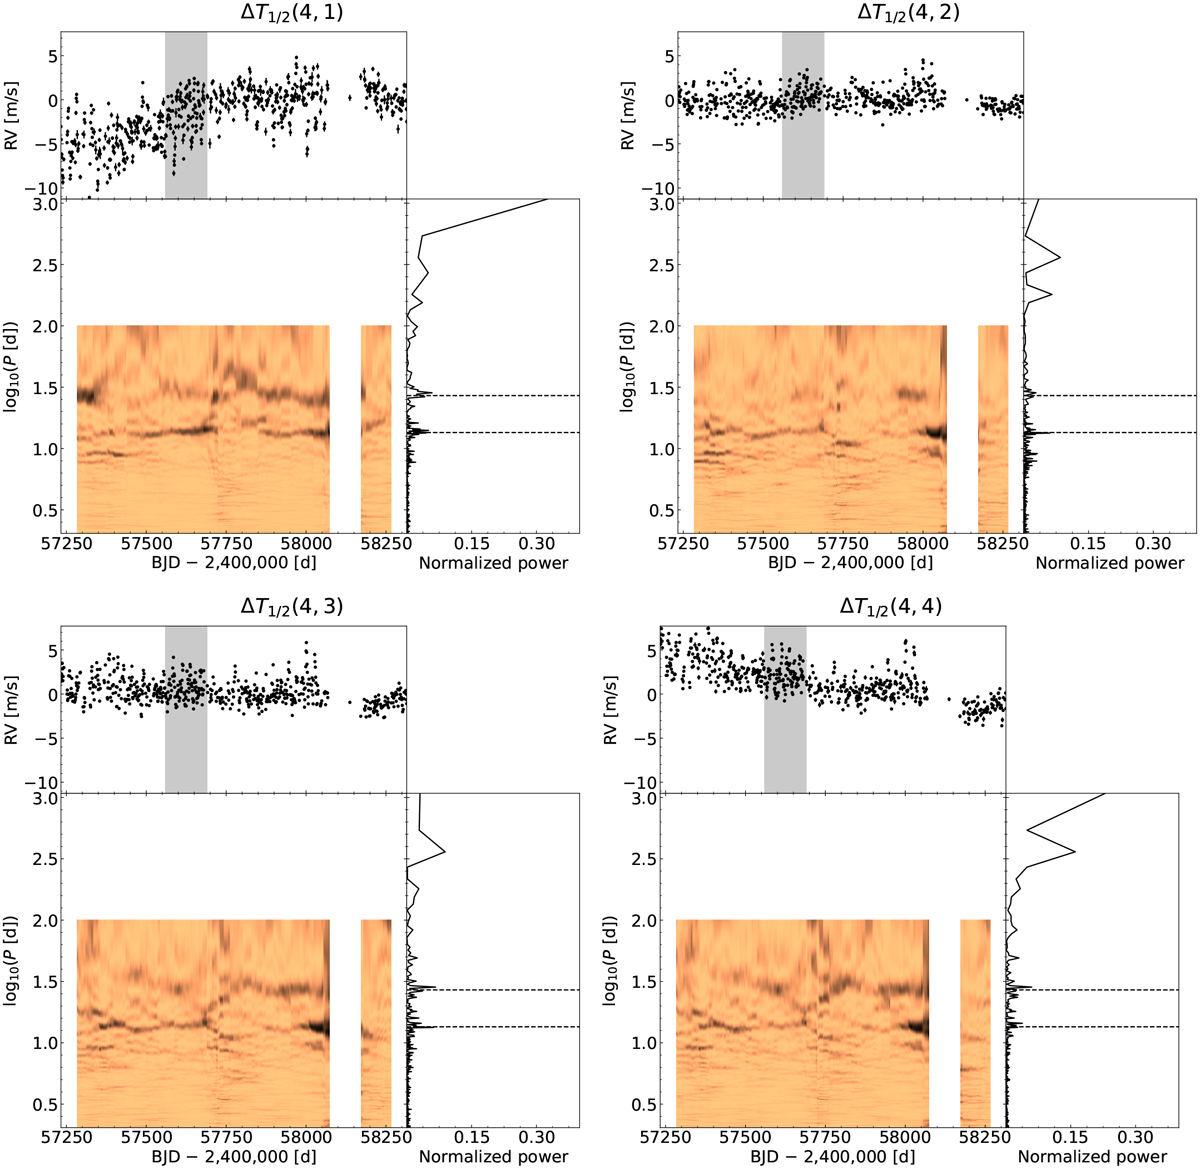
Sliding periodogram of the temperature-binned RV time series of the Sun. Upper panels: total RV time series with the short-term interval used in Sect. 4.1 indicated by the gray shaded area. Right panels: GLS periodogram of the total time series, with the solar rotation period and its first harmonic indicated by the dashed lines. The columns of the central color maps show the GLS periodogram of every 100-day window, where darker colors indicate stronger power. The window is shifted in steps of one day, and gaps correspond to windows in which more than 25% of the data points are missing.
Current usage metrics show cumulative count of Article Views (full-text article views including HTML views, PDF and ePub downloads, according to the available data) and Abstracts Views on Vision4Press platform.
Data correspond to usage on the plateform after 2015. The current usage metrics is available 48-96 hours after online publication and is updated daily on week days.
Initial download of the metrics may take a while.