Fig. 1
Download original image
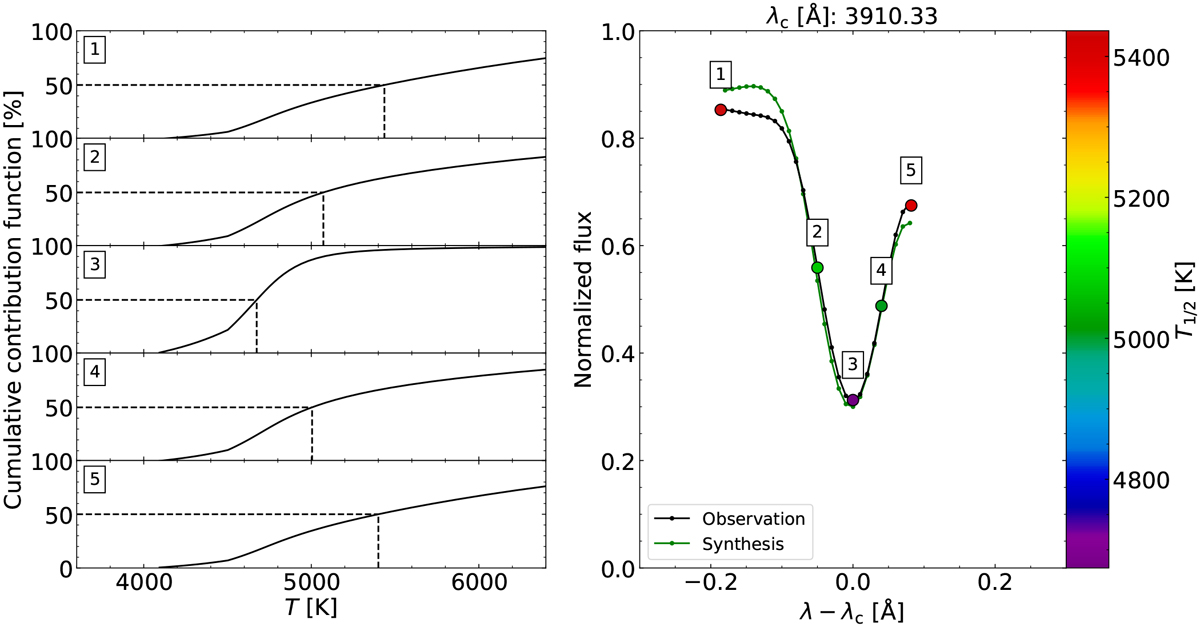
Average formation temperature across a spectral line. Left: normalized cumulative contribution function as a function of temperature at five points across the spectral line shown in the right panel. The dashed line indicates the location of T1/2, i.e., where the contribution function is 50%. Right: line profile of one of the solar lines. The five points for which the contribution function is computed are indicated by large dots color-coded with the T1/2values.
Current usage metrics show cumulative count of Article Views (full-text article views including HTML views, PDF and ePub downloads, according to the available data) and Abstracts Views on Vision4Press platform.
Data correspond to usage on the plateform after 2015. The current usage metrics is available 48-96 hours after online publication and is updated daily on week days.
Initial download of the metrics may take a while.