Open Access
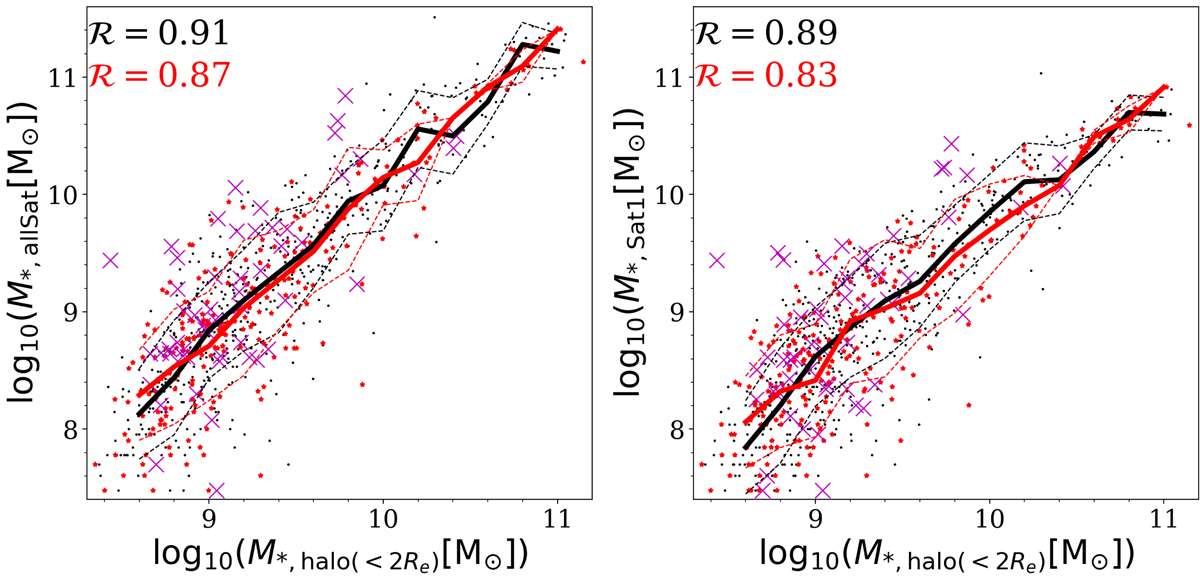
Fig. 9.
Download original image
Correlations from using the secondary progenitor masses M∗,allSat and M∗,Sat1 instead of the ex situ stellar masses in present-day galaxies, M∗,ExSitu and M∗,Ex1. Symbols are the same as in Fig. 8. The strongly stripped galaxies move upward, and some of them become outliers above the upper “+1σ” curves.
Current usage metrics show cumulative count of Article Views (full-text article views including HTML views, PDF and ePub downloads, according to the available data) and Abstracts Views on Vision4Press platform.
Data correspond to usage on the plateform after 2015. The current usage metrics is available 48-96 hours after online publication and is updated daily on week days.
Initial download of the metrics may take a while.