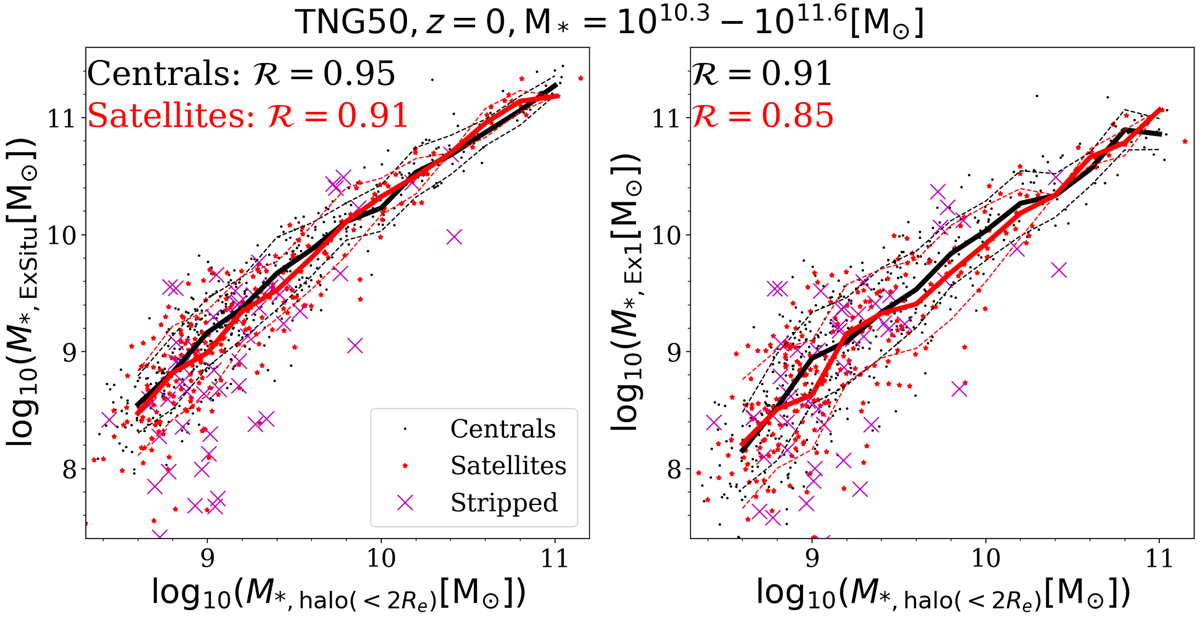
Fig. 8.
Download original image
Correlations of hot inner stellar halo mass, M*, halo(r < 2 Re), versus accreted stellar mass M*, Ex1 (left) and M*, ExSitu (right) for central and satellite galaxies separately. All TNG50 galaxies with M* = 1010.3 − 1011.6 M⊙, are included. The black dots are central galaxies, and the red dots are satellites. The thick black and red curves are the running median for central and satellite galaxies, respectively, while the thin dashed curves are the corresponding ±1σ scatter. The satellites with more than 20% of stellar mass stripped are marked by magenta crosses. The correlations are almost the same for central and satellite galaxies. The strongly stripped satellites tend to be located below the median of the correlations, and some of them deviate from the correlations significantly below the lower “−1σ” curves.
Current usage metrics show cumulative count of Article Views (full-text article views including HTML views, PDF and ePub downloads, according to the available data) and Abstracts Views on Vision4Press platform.
Data correspond to usage on the plateform after 2015. The current usage metrics is available 48-96 hours after online publication and is updated daily on week days.
Initial download of the metrics may take a while.