Fig. 5.
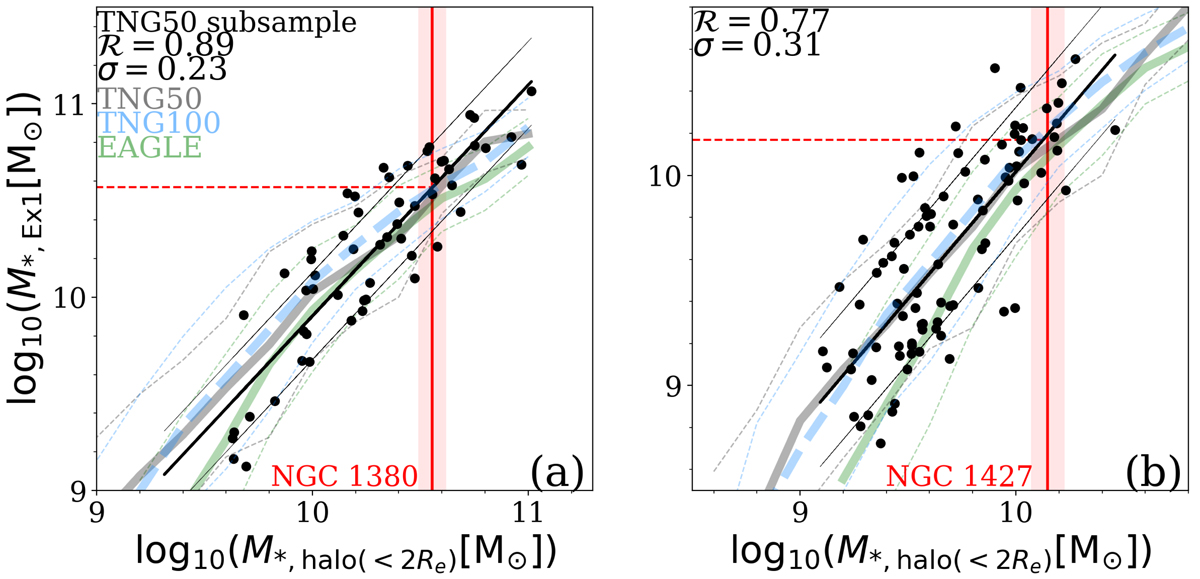
Download original image
Stellar masses of the most massive satellites (now-destroyed) that merged with NGC 1380 and NGC 1427. Panel a: correlation from cosmological simulations between the mass of the hot inner stellar halo, M*, halo(r < 2 Re), and the stellar mass, M*, Ex1, of the most massive merged satellite. The black dots are a subsample of TNG50 galaxies with similar mass and size as NGC 1380, the thick black line is a linear fit to the points, and the thin black lines indicate the ±1σ scatter. The Pearson correlation coefficients, ℛ, between M*, halo(< 2 Re) and M*, Ex1 and 1σ scatter against the linear fit for the TNG50 subsample are indicated. The vertical red line with shadows marks the mass and corresponding ±1σ uncertainty of NGC 1380’s hot inner stellar halo. The horizontal dashed line marks the satellite(s) mass inferred from the correlations. The thick and thin curves in gray, blue, and green in the background are the running median and ±1σ scatter of the whole sample of TNG50, TNG100, and EAGLE galaxies. Panel b: same to panel a, but for the subsample of TNG50 galaxies with similar mass and size to NGC 1427. The vertical red line marks the mass of NGC 1427’s hot inner stellar halo, and the horizontal dashed line marks the mass of the satellite(s) inferred from the correlations.
Current usage metrics show cumulative count of Article Views (full-text article views including HTML views, PDF and ePub downloads, according to the available data) and Abstracts Views on Vision4Press platform.
Data correspond to usage on the plateform after 2015. The current usage metrics is available 48-96 hours after online publication and is updated daily on week days.
Initial download of the metrics may take a while.