Fig. A.5.
Download original image
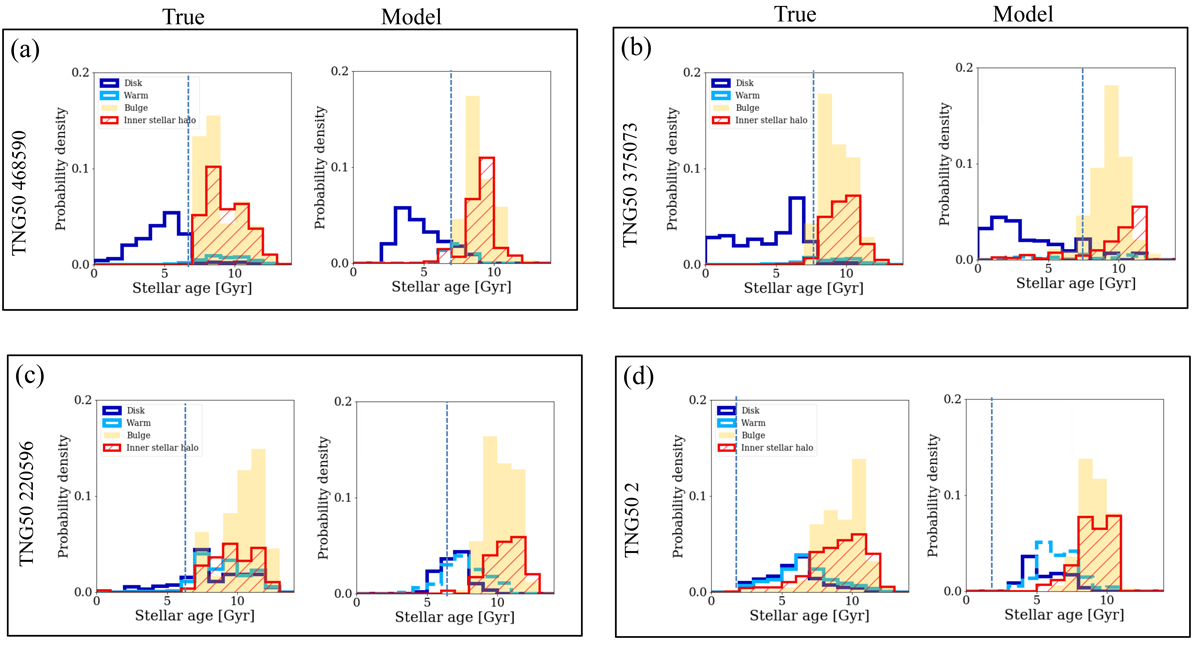
Verification of the method to assign a time limit to the merger from the age distributions of the galaxy components. Shown are the stellar age distributions of the disk, warm, bulge, and hot inner stellar halo components for TNG50 468590, TNG50 375073, TNG50 220596, and TNG50 2 from Panel (a) to Panel (d). In each panel, the left plot is the true stellar age distribution from the stellar particles in the simulation, the right plot is the distribution from our best fitting model, and the vertical dashed line marks the end of the last massive merger.
Current usage metrics show cumulative count of Article Views (full-text article views including HTML views, PDF and ePub downloads, according to the available data) and Abstracts Views on Vision4Press platform.
Data correspond to usage on the plateform after 2015. The current usage metrics is available 48-96 hours after online publication and is updated daily on week days.
Initial download of the metrics may take a while.