Fig. A.3.
Download original image
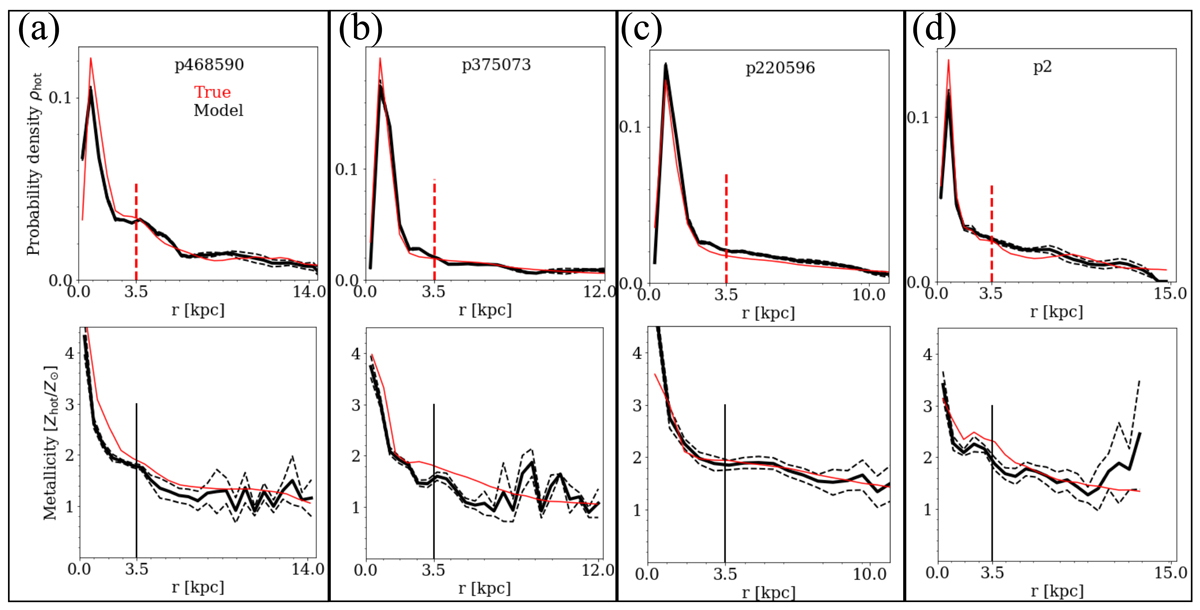
Verification of the bulge versus hot inner stellar halo decomposition. Shown are the probability density phot (top panel) and metallicity Zhot/Z⊙ (bottom panel) of the hot orbits as a function of radius for TNG50 468590, TNG50 375073, TNG50 220596, and TNG50 2, from Panel (a) to Panel (d). In each panel, the red curve is the true profile from the simulation, and the thick and dashed black curves are the mean and 1σ scatter of our best fitting models. The vertical lines mark the position of r = 3.5 kpc, where we separate the bulge from hot inner stellar halo.
Current usage metrics show cumulative count of Article Views (full-text article views including HTML views, PDF and ePub downloads, according to the available data) and Abstracts Views on Vision4Press platform.
Data correspond to usage on the plateform after 2015. The current usage metrics is available 48-96 hours after online publication and is updated daily on week days.
Initial download of the metrics may take a while.