Fig. A.2.
Download original image
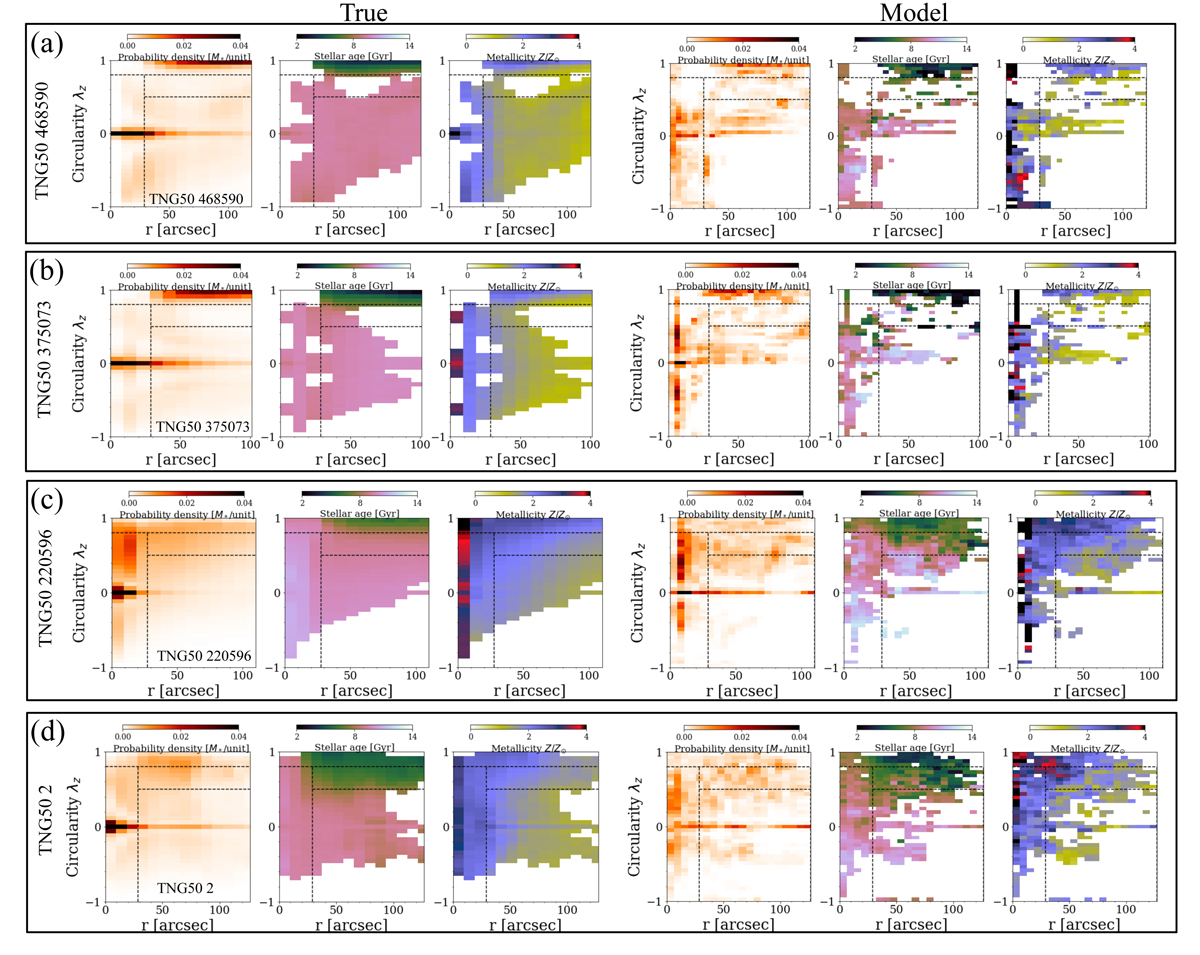
Verification of the population-orbit method with mock data created from galaxies of the TNG50 simulation: TNG50 468590, TNG50 375073, TNG50 220596, and TNG50 2 from Panel (a) to Panel (d). For each galaxy, the left three plots show the distributions directly from the simulation, which are well matched by those extracted from the best fitting population-orbit models in the right three plots. From left to right, we show the distributions in phase space of the time-averaged radius, r, versus circularity, λz, of orbital probability density p(r, λz), age t(r, λz), and metallicity Z(λz, r), all shown only within 2 Re. The dashed lines indicate our orbital-based division into four components: disk, bulge, warm component, and hot inner stellar halo. The corresponding mass fractions within a 2 Re radius are listed in Table A.1.
Current usage metrics show cumulative count of Article Views (full-text article views including HTML views, PDF and ePub downloads, according to the available data) and Abstracts Views on Vision4Press platform.
Data correspond to usage on the plateform after 2015. The current usage metrics is available 48-96 hours after online publication and is updated daily on week days.
Initial download of the metrics may take a while.