Fig. 9.
Download original image
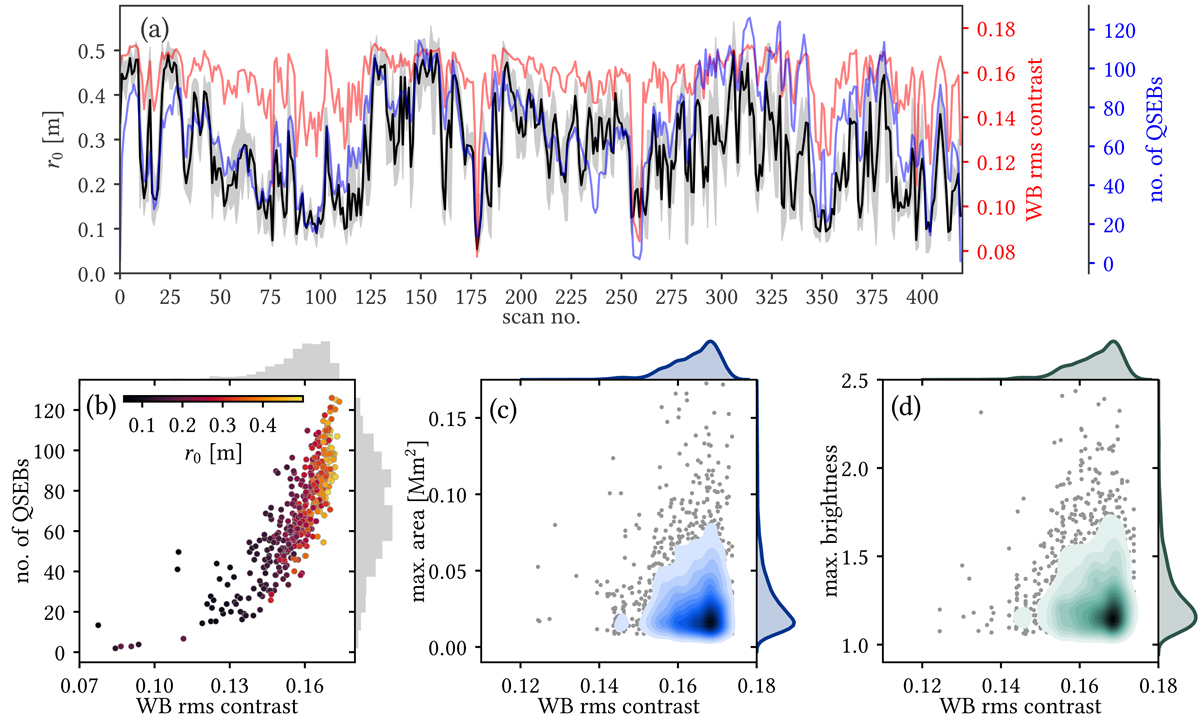
Dependence of the detected number of QSEBs and their measured area and brightness on atmospheric seeing conditions. (a) Variation of rms contrast of WB images (red), Fried’s parameter r0 (black), and detected number of QSEBs (blue) during the observed time series. The shaded gray area indicates seeing (r0) variation within an Hβ line scan. (b) Scatter plot between rms contrast of WB images and the number of detected QSEBs. The colors of the data points show r0 values. (c) Scatter and JPDFs between rms contrast of WB images and area of QSEBs. (d) Scatter and JPDFs between rms contrast of WB images and brightness of QSEBs. Darker color shades in JPDFs plots indicate high-density occurrence.
Current usage metrics show cumulative count of Article Views (full-text article views including HTML views, PDF and ePub downloads, according to the available data) and Abstracts Views on Vision4Press platform.
Data correspond to usage on the plateform after 2015. The current usage metrics is available 48-96 hours after online publication and is updated daily on week days.
Initial download of the metrics may take a while.