Fig. 8.

Download original image
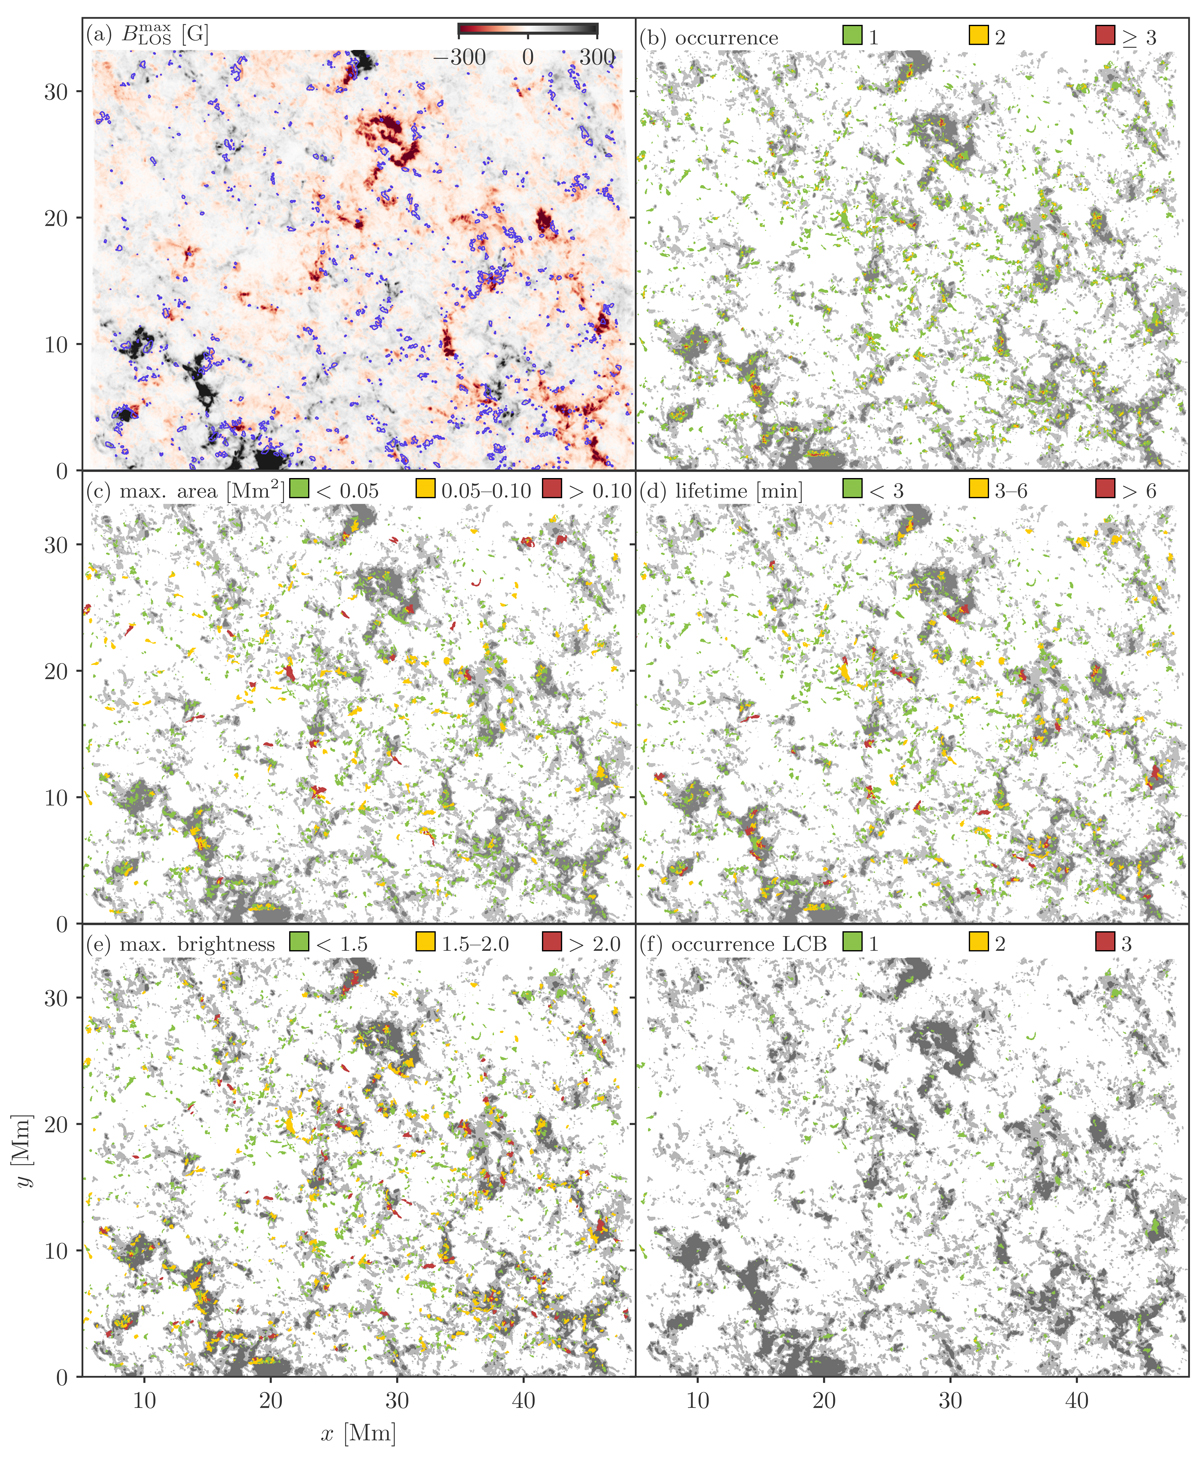
Spatial distribution of QSEBs and their magnetic environment over the full 1 h duration of the time series. Panel a shows the extremum of BLOS over the whole 1 h duration of the time series at each pixel. Blue contours mark pixels that have |BLOS|> 50 G for both polarities during the time series. Panels b, c, d, and e: spatial location, area, lifetime, and brightness of QSEBs, respectively. In case of a multiple occurrence of QSEBs at a pixel (yellow and red areas in panel b), an average value of the parameters is presented in panels c–e. Panel f displays the location of QSEBs with line core brightening (LCB) in Hβ. The parameters presented in panels b–f are segregated into three different bins. The values of the respective colors are given in the legend above each panel. The darker gray background in panels b–f marks regions where ![]() is greater than 100 G, while lighter gray shade represents regions where
is greater than 100 G, while lighter gray shade represents regions where ![]() is between 50 and 100 G.
is between 50 and 100 G.
Current usage metrics show cumulative count of Article Views (full-text article views including HTML views, PDF and ePub downloads, according to the available data) and Abstracts Views on Vision4Press platform.
Data correspond to usage on the plateform after 2015. The current usage metrics is available 48-96 hours after online publication and is updated daily on week days.
Initial download of the metrics may take a while.


