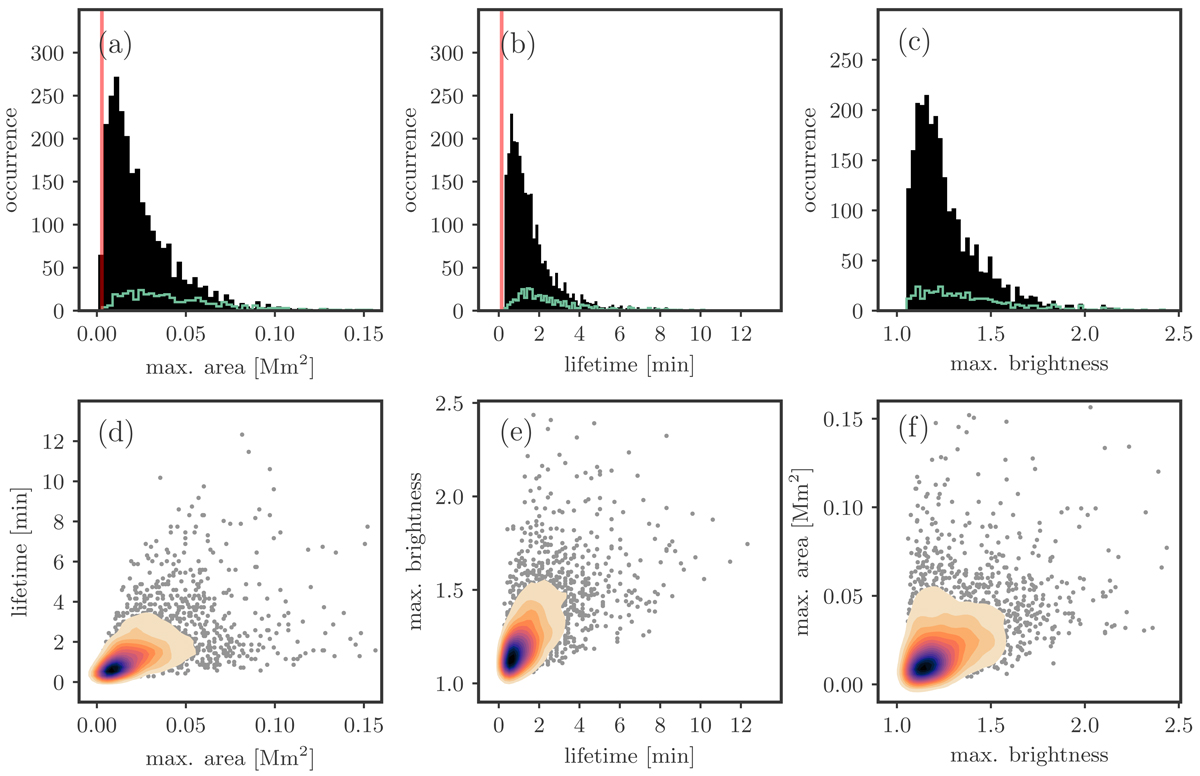
Fig. 6.
Download original image
Maximum area, lifetime, and maximum brightness statistics of QSEBs. The total number of QSEBs is 2809. The filled black histograms in panels a, b, and c represent the maximum area, lifetime, and maximum brightness distribution of QSEBs, respectively. The statistics of QSEBs with brightening in the Hβ line core (396 QSEBs) are presented by green histograms. The vertical red line in panels a and b marks the lower limit set by sampling: 0.0008 Mm2 (one pixel) in area and 8.6 s in lifetime. Panels d–f: multivariate JPDFs and scatter plots between the maximum area, lifetime, and maximum brightness. The dark blue shade of the JPDFs indicates the highest density occurrence, and the lighter orange shade regions represent the low-density distribution. One outlier QSEB that has the longest lifetime (20.5 min), largest maximum area (0.2603 Mm2), and highest maximum brightness (2.76) is not shown in order to restrict the plotting ranges.
Current usage metrics show cumulative count of Article Views (full-text article views including HTML views, PDF and ePub downloads, according to the available data) and Abstracts Views on Vision4Press platform.
Data correspond to usage on the plateform after 2015. The current usage metrics is available 48-96 hours after online publication and is updated daily on week days.
Initial download of the metrics may take a while.