Fig. 4.
Download original image
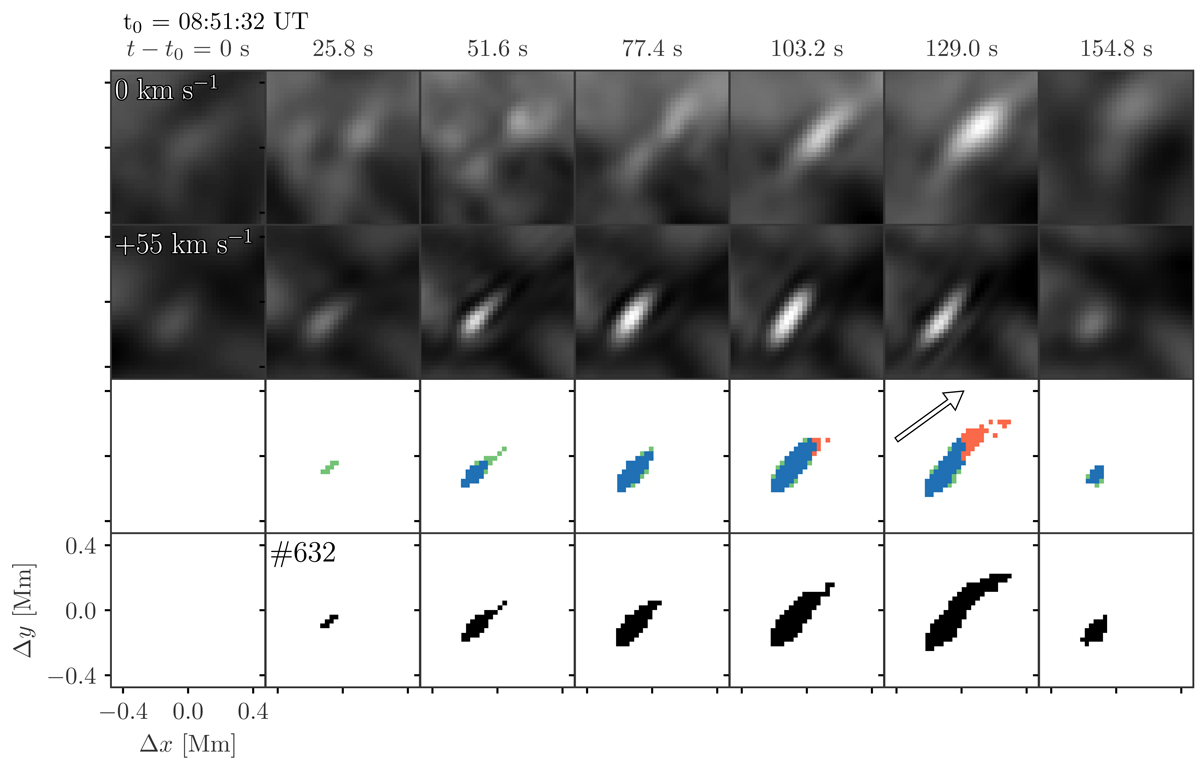
Temporal evolution of a QSEB and illustration of the detection method. The top row shows a series of Hβ line core images. Every third image is shown as the cadence is 8.6 s. The second row shows the corresponding Hβ red wing images. The third row shows the locations of the selected QSEB RPs shown in Fig. 2; the locations of RP 0–8, RP 9–15, and RP 16–23 are indicated by blue, green, and red, respectively. The bottom rows shows the corresponding binary masks of QSEB detections after the morphological operation. The arrow in the third row shows the direction toward the nearest limb.
Current usage metrics show cumulative count of Article Views (full-text article views including HTML views, PDF and ePub downloads, according to the available data) and Abstracts Views on Vision4Press platform.
Data correspond to usage on the plateform after 2015. The current usage metrics is available 48-96 hours after online publication and is updated daily on week days.
Initial download of the metrics may take a while.