Fig. 3.
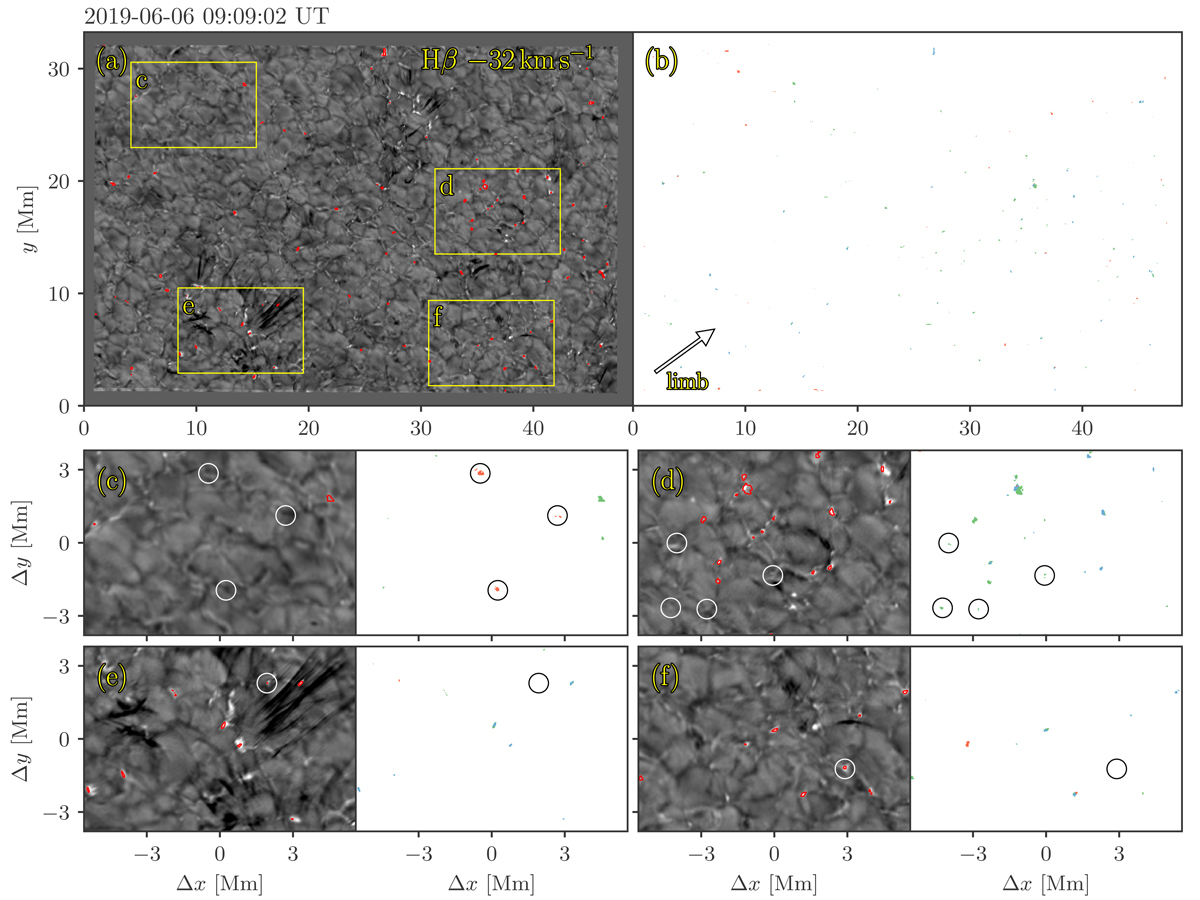
Download original image
Detections of QSEBs using the k-means clustering technique and morphological operations. Panel a: observed FOV in the Hβ blue wing at Doppler offset −32 km s−1. The red contours mark locations of 91 detected QSEBs. Panel b: locations of the selected QSEB RPs shown in Fig. 2; locations of RP 0–8, RP 9–15, and RP 16–23 are indicated by blue, green, and red colours, respectively. Panels c–f: zoom-ins on four different areas marked by the white boxes in (a) showing a similar pair of panels of Hβ wing and RP maps as in (a) and (b). Circles in panels c and d mark examples of areas of RPs that did not end up as QSEB detections: these areas could not be connected in space or time to nearby RP 0–8 locations. Circles in (e) and (f) mark examples of QSEB detections that do not have selected RPs in this particular map: these detections were connected to RP 0–8 locations in the time steps before or after. The arrow in panel b shows the direction towards the nearest limb. An animation of this figure is available online
Current usage metrics show cumulative count of Article Views (full-text article views including HTML views, PDF and ePub downloads, according to the available data) and Abstracts Views on Vision4Press platform.
Data correspond to usage on the plateform after 2015. The current usage metrics is available 48-96 hours after online publication and is updated daily on week days.
Initial download of the metrics may take a while.