Free Access
Fig. A.2.
Download original image
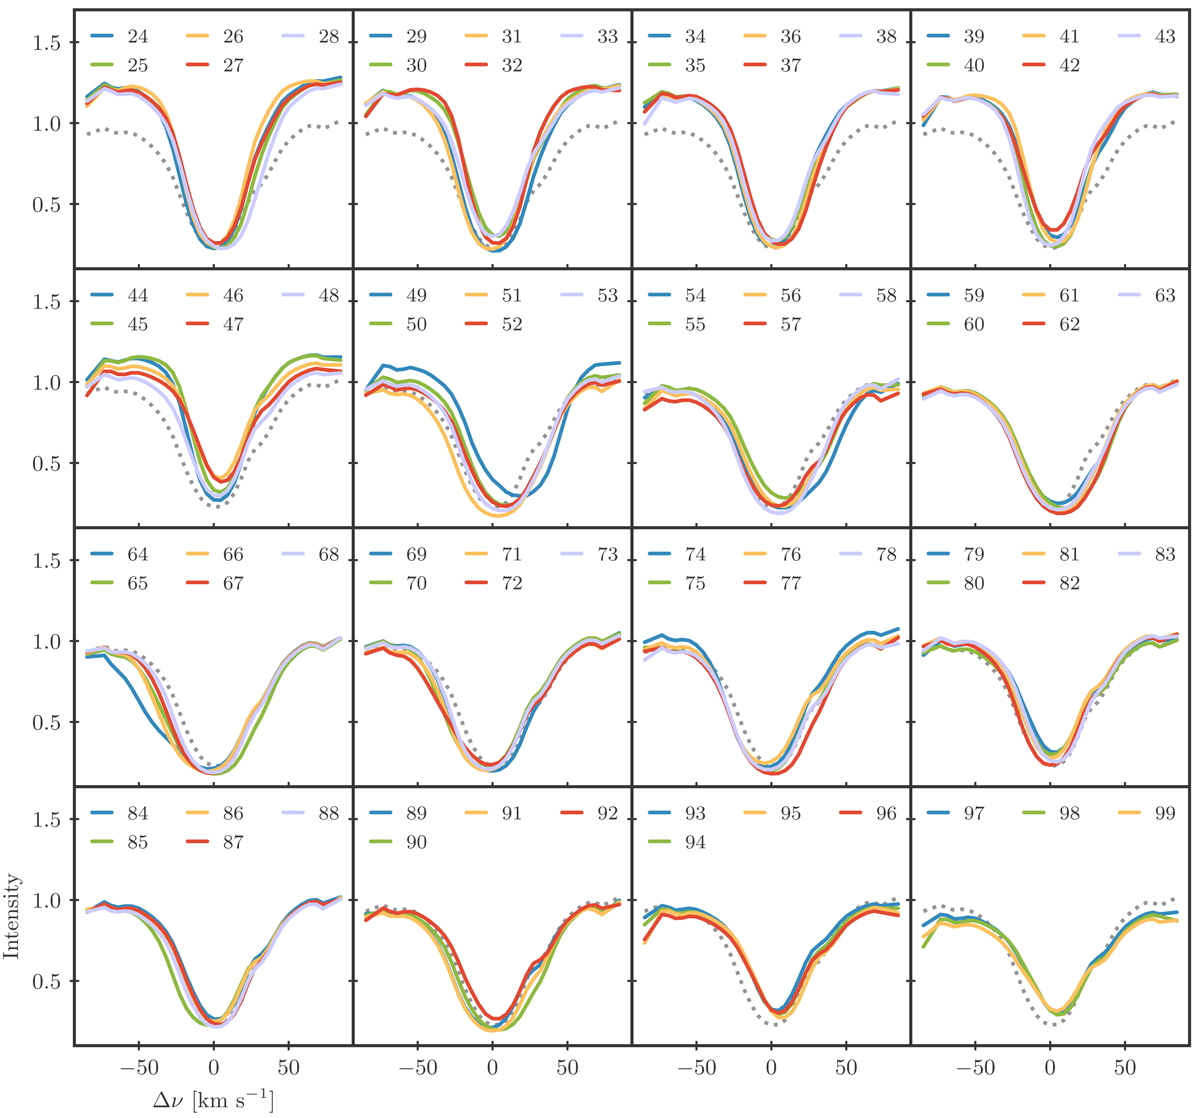
Representative profiles obtained through k-means clustering of the Hβ spectra. The remaining 76 RPs that were not considered as QSEB profiles are shown in 16 panels (RPs 24–99). The QSEB RPs (0–23) are shown in Fig. 2. The dashed gray profile in each panel represents the average quiet-Sun profile.
Current usage metrics show cumulative count of Article Views (full-text article views including HTML views, PDF and ePub downloads, according to the available data) and Abstracts Views on Vision4Press platform.
Data correspond to usage on the plateform after 2015. The current usage metrics is available 48-96 hours after online publication and is updated daily on week days.
Initial download of the metrics may take a while.