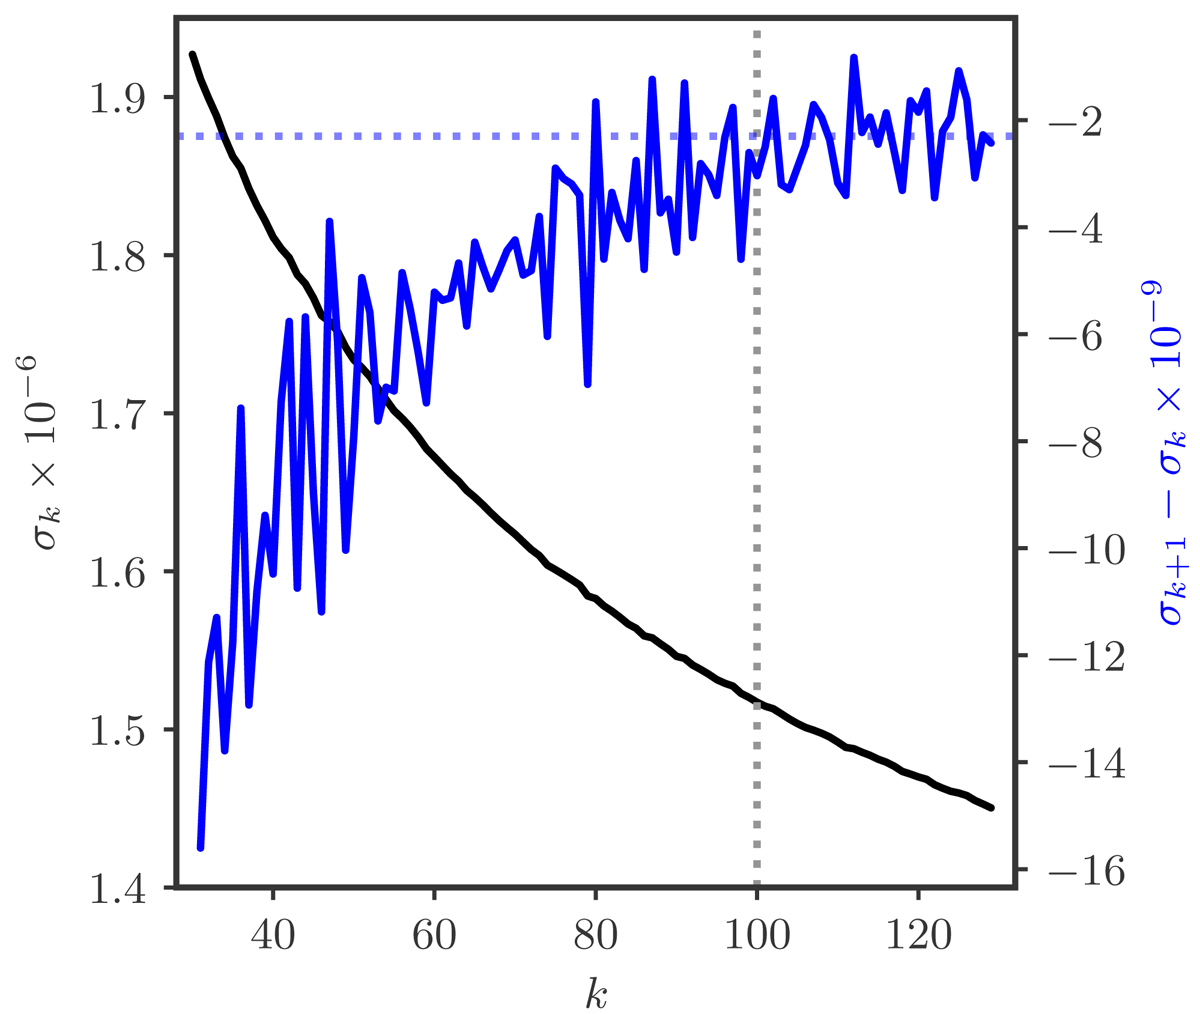
Fig. A.1.
Download original image
Finding the number of clusters, k, to optimally cluster the Hβ spectra. Variation in the inertia (σk) with respect to k is shown in black. The presented σk is normalized with the total number of data points used in the training of the k-means model. The running difference σk + 1 − σk is plotted in blue. The vertical dotted black line indicates the used number of clusters, k = 100, for the final clustering.
Current usage metrics show cumulative count of Article Views (full-text article views including HTML views, PDF and ePub downloads, according to the available data) and Abstracts Views on Vision4Press platform.
Data correspond to usage on the plateform after 2015. The current usage metrics is available 48-96 hours after online publication and is updated daily on week days.
Initial download of the metrics may take a while.