Fig. 9.
Download original image
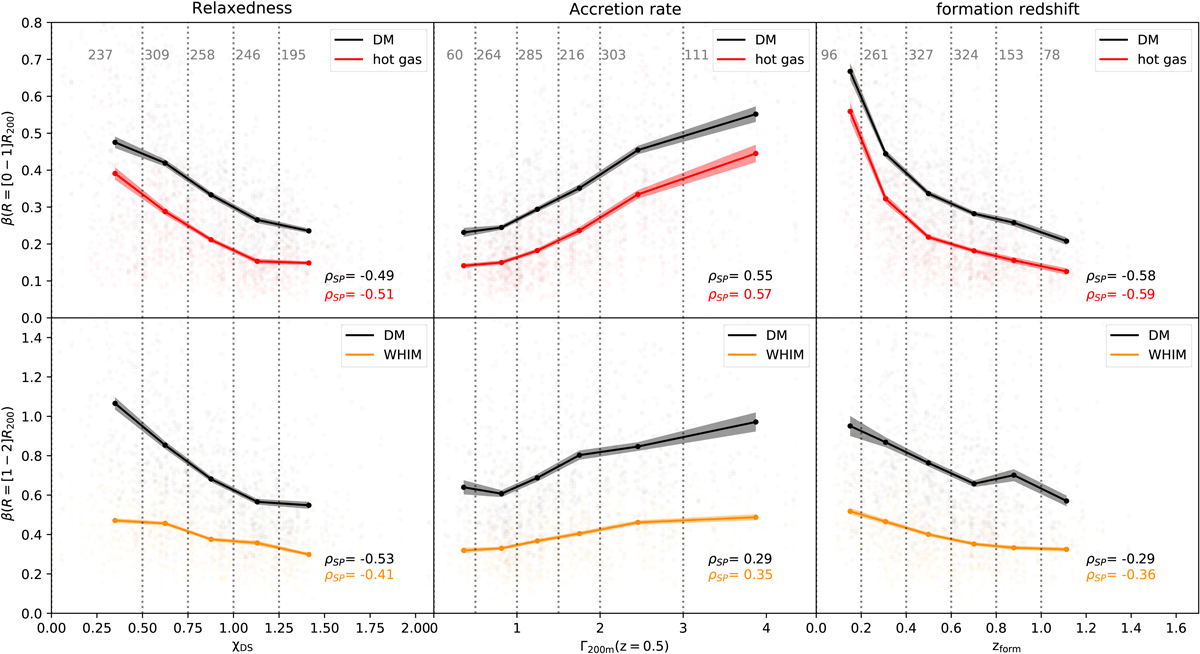
Distribution of azimuthal symmetric excess, β (as defined in Eq. (12)), computed inside clusters (R < R200) in top panels and at cluster peripheries (1 < R[R200]< 2) in bottom panels, as a function of different halo properties: level of relaxation on the left, mass-accretion rate in the middle, and formation redshift on the right. The mean profiles of β and their errors are shown in solid lines. The number of objects used to compute the average in each bin of the x-axis (shown with grey dotted lines) is written above the figures in grey.
Current usage metrics show cumulative count of Article Views (full-text article views including HTML views, PDF and ePub downloads, according to the available data) and Abstracts Views on Vision4Press platform.
Data correspond to usage on the plateform after 2015. The current usage metrics is available 48-96 hours after online publication and is updated daily on week days.
Initial download of the metrics may take a while.