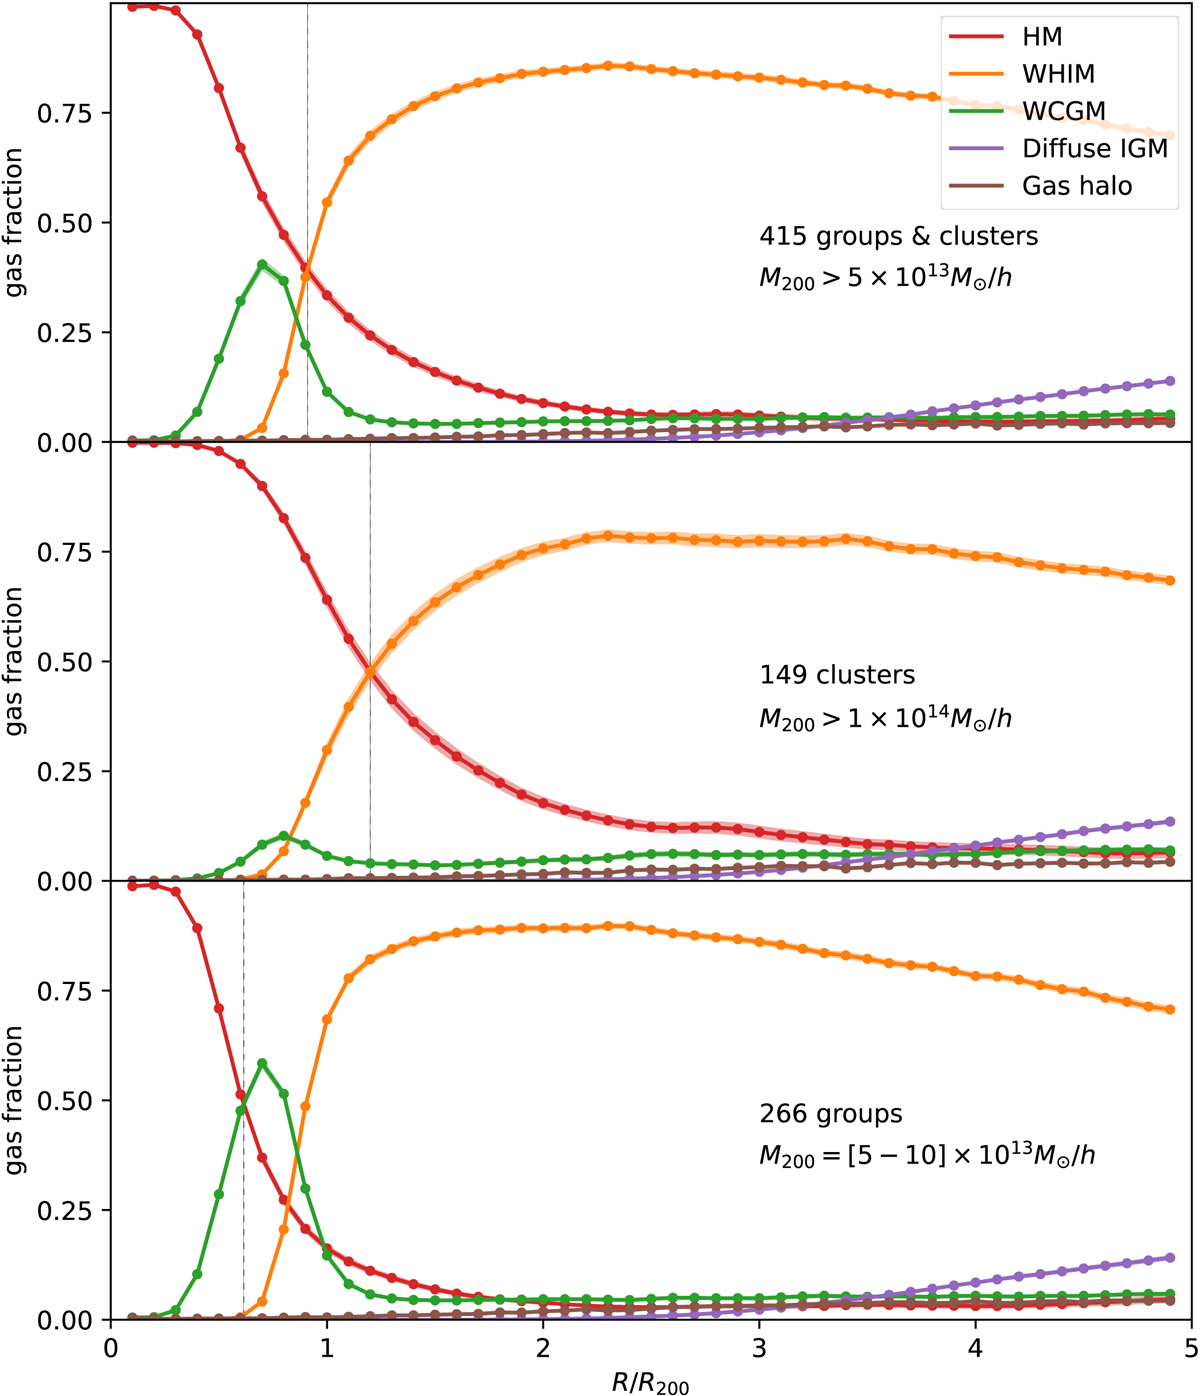
Fig. 2.
Download original image
Mean gas mass fraction profiles (see Eq. (7)) of the five different gas phases around all halos in our sample (top), only galaxy clusters (middle), and only galaxy groups (bottom). The radial boundary at which the hot gas phase is no longer dominant is shown by grey vertical lines and is about RHOT ∼ 0.91, 1.20 and 0.61 for the all groups and clusters, only clusters, and only groups, respectively.
Current usage metrics show cumulative count of Article Views (full-text article views including HTML views, PDF and ePub downloads, according to the available data) and Abstracts Views on Vision4Press platform.
Data correspond to usage on the plateform after 2015. The current usage metrics is available 48-96 hours after online publication and is updated daily on week days.
Initial download of the metrics may take a while.