Fig. 1
Download original image
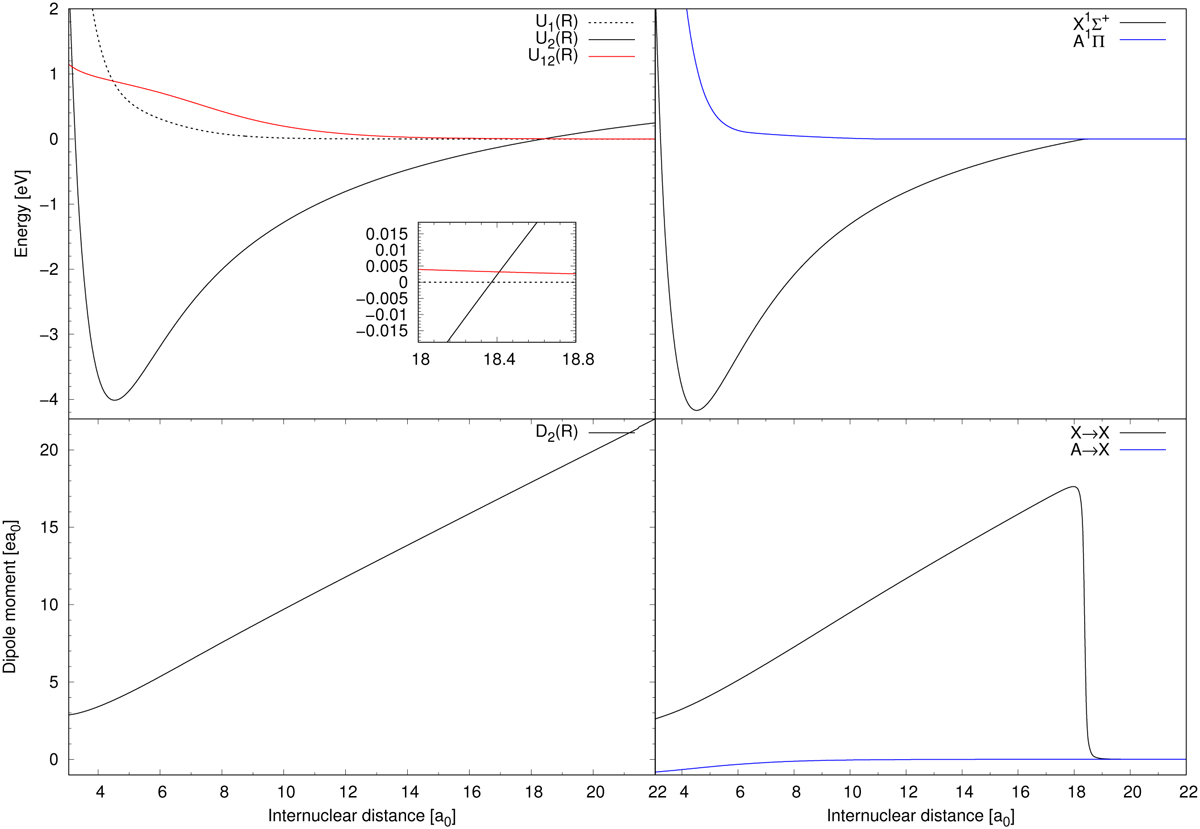
Ab initio data. Top left: the potential energy curves for diabatic states U1(R) and U2(R) and their coupling U12(R) are illustrated. Bottom left: the dipole moment of the diabatic state 2 is illustrated. Top right: the potential energy curves of the Χ1Σ+ and A1Π states within the BO approximation. Bottom right: the Χ1Σ+ permanent dipole-moment and A1Π → Χ1Σ+ transition dipole-moment functions. All the data were taken from Giese & York (2004) and Zeiri & Balint-Kurti (1983).
Current usage metrics show cumulative count of Article Views (full-text article views including HTML views, PDF and ePub downloads, according to the available data) and Abstracts Views on Vision4Press platform.
Data correspond to usage on the plateform after 2015. The current usage metrics is available 48-96 hours after online publication and is updated daily on week days.
Initial download of the metrics may take a while.