Fig. 9
Download original image
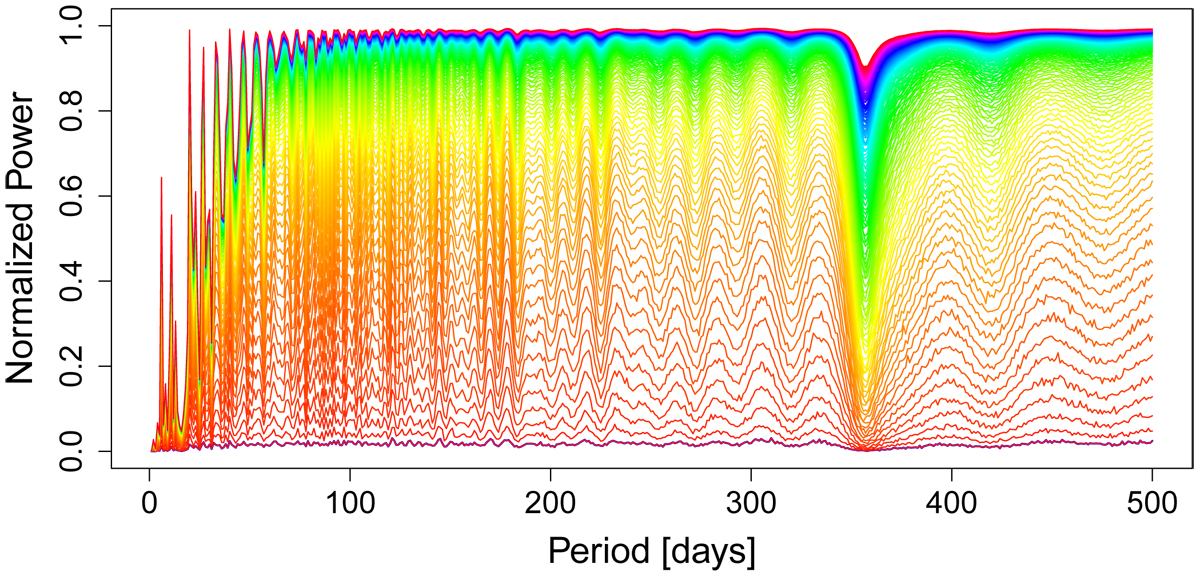
Relation between the peak normalized power P of the GLS periodogram obtained from a synthetic Keplerian RV signal and the period of that signal (i.e., the orbital period of the synthetic exoplanet). The different colors represent the different K values imposed on the Keplerian signals, which increase from bottom to top. The ruggedness of the lines is due to the white noise that was also injected into the RV data series. Regardless of the considered K (i.e., the color), P decreases at ~365 days (close to the revolution period of the Earth), as expected in ground-based observations.
Current usage metrics show cumulative count of Article Views (full-text article views including HTML views, PDF and ePub downloads, according to the available data) and Abstracts Views on Vision4Press platform.
Data correspond to usage on the plateform after 2015. The current usage metrics is available 48-96 hours after online publication and is updated daily on week days.
Initial download of the metrics may take a while.