Fig. 8

Download original image
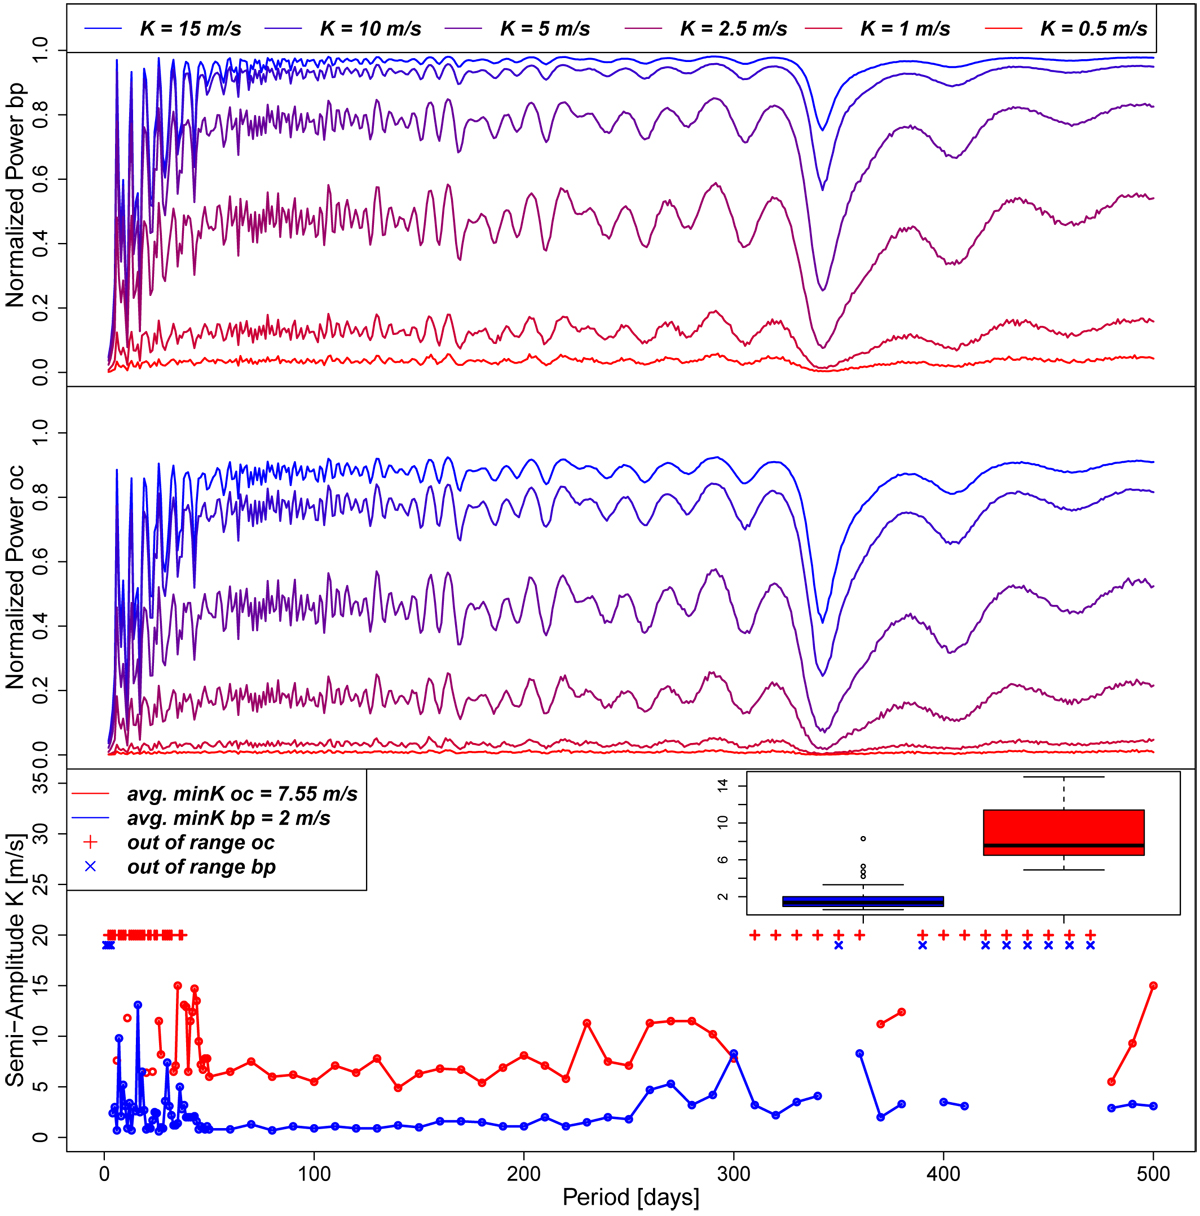
Upper panels: GLS periodograms derived from synthetic Keplerian RV signals of K = 15, 10, 5, 2.5, 1, and 0.5 m s−1, which were perturbed by injecting white noise whose amplitude follows a normal distribution with standard deviation of 1.75 m s−1 (top) and 3.48 m s−1 (middle). The unevenly sampled temporal baseline (i.e., the temporal baseline of α Cen B) is responsible for the power decrease at 365 days, as pointed out in Sect. 3.4.2. Bottom panel: detection thresholds of synthetic exoplanets injected into the α Cen B RV time series. It is the minimum semiamplitude K at which a synthetic exoplanet of a given period is recovered from the two different GLS periodograms. The minimum K values are inferred from the ![]() time series (bp method, dashed blue line) and from the
time series (bp method, dashed blue line) and from the ![]() time series (oc method, solid red line). Blue crosses (bp method) or red crosses (oc method) highlight the null detection of any exoplanet having K ≤ 15 m s−1. For both methods, a null detection occurs at ~365 days, where the GLS normalized power drops. Overall, by correcting for stellar activity on each of the five temporal segments found by the bp method, the detection threshold of an exoplanet lowers by 74% on average. The two boxplots represented in the top right inset show the distributions of the minimum K for the two methods. The two distributions are statistically different as quantified by the Wilcoxon test through its p-value = 2.22 × 10⁻¹⁶. The detection threshold of an exoplanet lowers by 78% on average, when focusing on planets up to an orbital period of 250 days.
time series (oc method, solid red line). Blue crosses (bp method) or red crosses (oc method) highlight the null detection of any exoplanet having K ≤ 15 m s−1. For both methods, a null detection occurs at ~365 days, where the GLS normalized power drops. Overall, by correcting for stellar activity on each of the five temporal segments found by the bp method, the detection threshold of an exoplanet lowers by 74% on average. The two boxplots represented in the top right inset show the distributions of the minimum K for the two methods. The two distributions are statistically different as quantified by the Wilcoxon test through its p-value = 2.22 × 10⁻¹⁶. The detection threshold of an exoplanet lowers by 78% on average, when focusing on planets up to an orbital period of 250 days.
Current usage metrics show cumulative count of Article Views (full-text article views including HTML views, PDF and ePub downloads, according to the available data) and Abstracts Views on Vision4Press platform.
Data correspond to usage on the plateform after 2015. The current usage metrics is available 48-96 hours after online publication and is updated daily on week days.
Initial download of the metrics may take a while.


