Fig. 6
Download original image
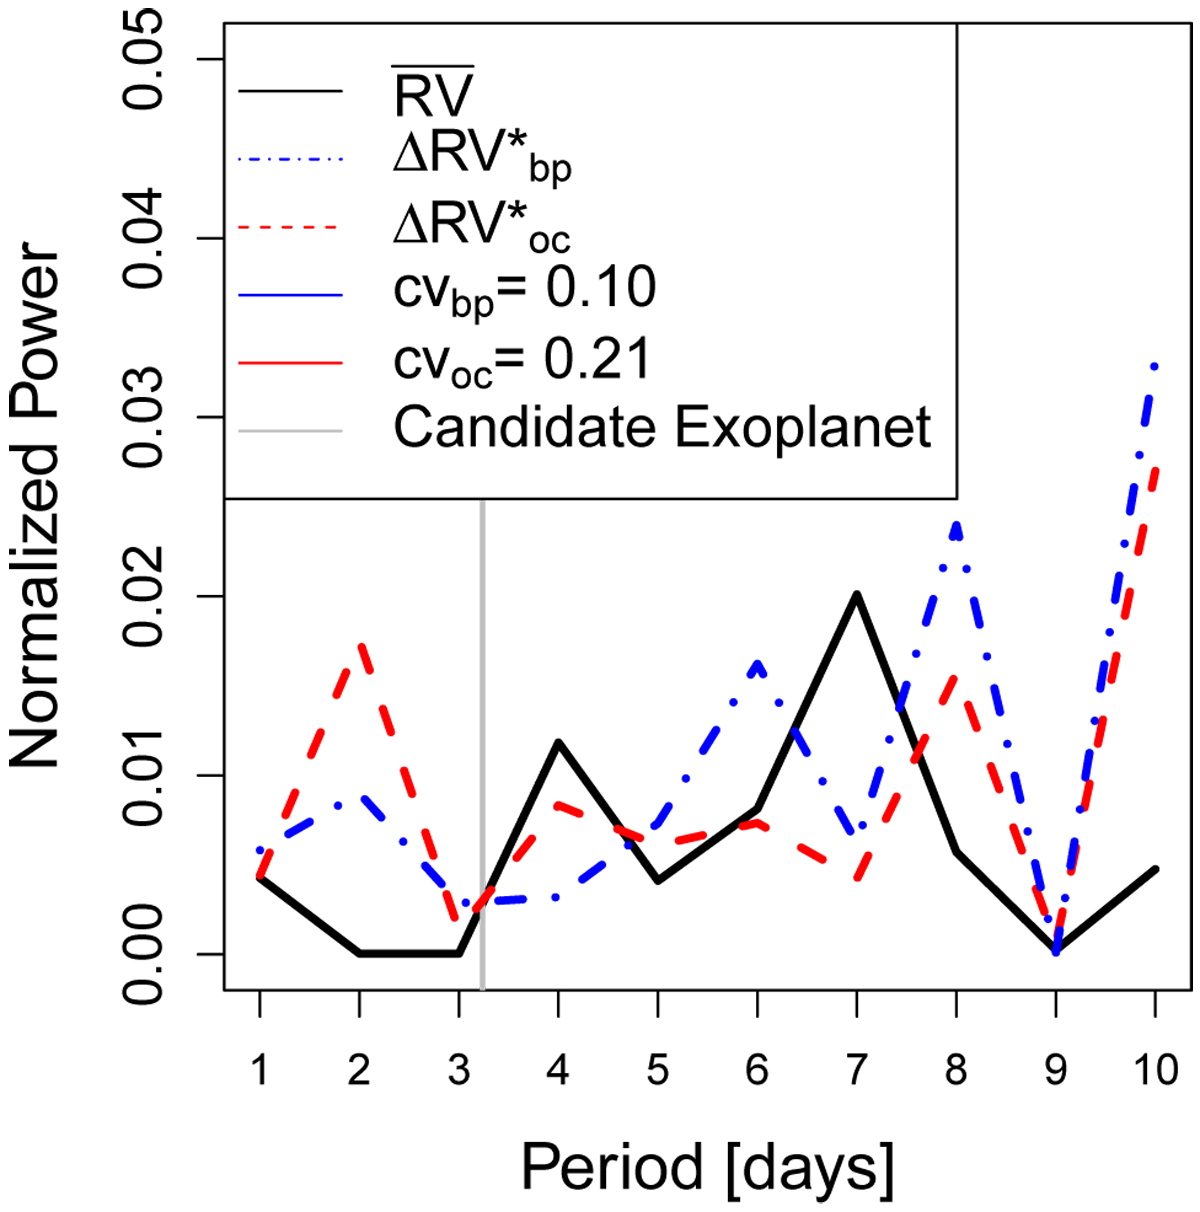
GLS periodograms of α Cen B derived from the subset of 459 RVs, also analyzed by Dumusque et al. (2012); Rajpaul et al. (2015). In detail, the periodograms have been computed from the original ![]() time series (solid black line),
time series (solid black line), ![]() (dashed red line), and
(dashed red line), and ![]() (dash-dotted blue line). The plot focuses on the neighborhood of 3.2357 days (highlighted as a vertical gray line), which corresponds to the orbital period of the exoplanet announced by Dumusque et al. (2012) and then disproved by Rajpaul et al. (2015). We note that all the GLS peaks are below the cv thresholds for both of the methods.
(dash-dotted blue line). The plot focuses on the neighborhood of 3.2357 days (highlighted as a vertical gray line), which corresponds to the orbital period of the exoplanet announced by Dumusque et al. (2012) and then disproved by Rajpaul et al. (2015). We note that all the GLS peaks are below the cv thresholds for both of the methods.
Current usage metrics show cumulative count of Article Views (full-text article views including HTML views, PDF and ePub downloads, according to the available data) and Abstracts Views on Vision4Press platform.
Data correspond to usage on the plateform after 2015. The current usage metrics is available 48-96 hours after online publication and is updated daily on week days.
Initial download of the metrics may take a while.