Fig. 4
Download original image
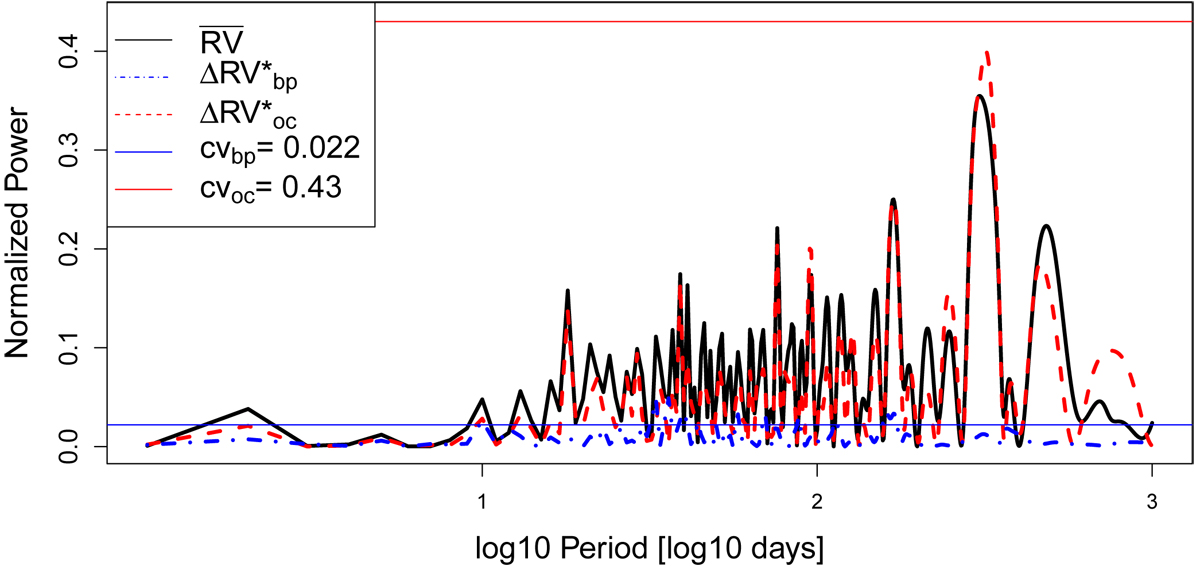
GLS periodograms of α Cen B derived from the original ![]() time series (solid black line),
time series (solid black line), ![]() (dashed red line), and
(dashed red line), and ![]() (dash-dotted blue line). The x-axis uses the base-10 logarithmic transformation of the period in order to improve the readability of the plot. The GLS periodogram obtained from
(dash-dotted blue line). The x-axis uses the base-10 logarithmic transformation of the period in order to improve the readability of the plot. The GLS periodogram obtained from ![]() does not show any of the periodical peaks caused by stellar signals, which are instead present in the GLS periodogram obtained from
does not show any of the periodical peaks caused by stellar signals, which are instead present in the GLS periodogram obtained from ![]() . The cv values for
. The cv values for ![]() and
and ![]() are displayed as solid red and blue lines, respectively.
are displayed as solid red and blue lines, respectively.
Current usage metrics show cumulative count of Article Views (full-text article views including HTML views, PDF and ePub downloads, according to the available data) and Abstracts Views on Vision4Press platform.
Data correspond to usage on the plateform after 2015. The current usage metrics is available 48-96 hours after online publication and is updated daily on week days.
Initial download of the metrics may take a while.