Fig. 3
Download original image
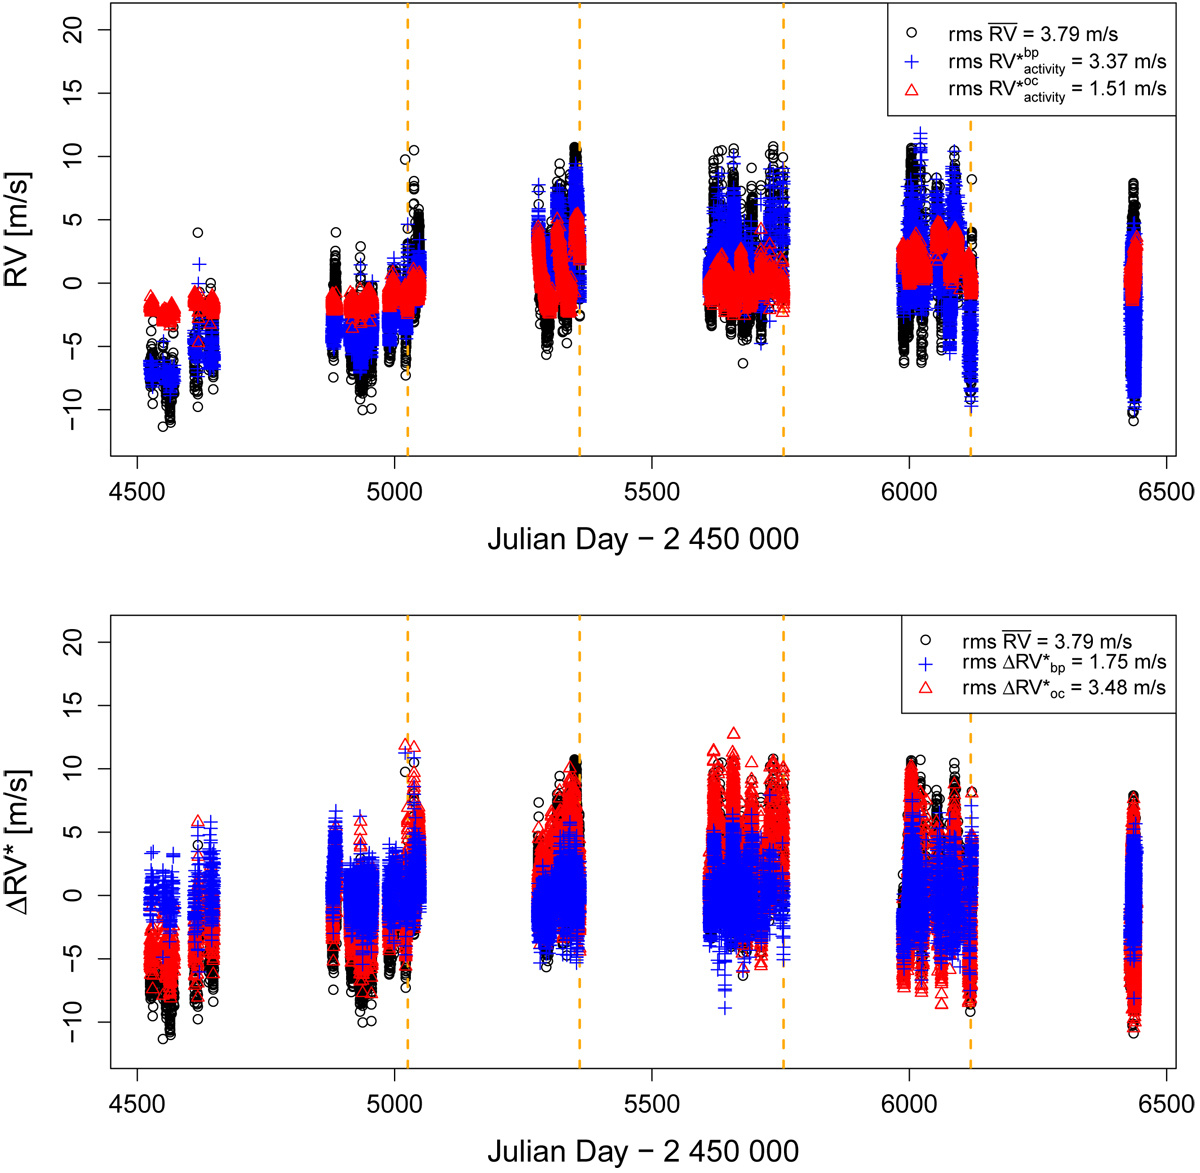
Modeling of the stellar activity of α Cen B, as performed by the bp and oc methods. Top panel: signal due to stellar activity as estimated by the bp method (blue crosses) and by the oc method (red triangles) superimposed to the ![]() time series (black circles) of α Cen B. Bottom panel: ∆RV* as computed by the bp method (blue crosses) and by the oc method (red triangles). The black circles on the background show the original
time series (black circles) of α Cen B. Bottom panel: ∆RV* as computed by the bp method (blue crosses) and by the oc method (red triangles). The black circles on the background show the original ![]() time series, enabling a visual comparison of the improvement achieved by the bp method in the data correction. The change point locations (Table 3) are displayed in both plots as vertical orange dashed lines.
time series, enabling a visual comparison of the improvement achieved by the bp method in the data correction. The change point locations (Table 3) are displayed in both plots as vertical orange dashed lines.
Current usage metrics show cumulative count of Article Views (full-text article views including HTML views, PDF and ePub downloads, according to the available data) and Abstracts Views on Vision4Press platform.
Data correspond to usage on the plateform after 2015. The current usage metrics is available 48-96 hours after online publication and is updated daily on week days.
Initial download of the metrics may take a while.