Fig. 2
Download original image
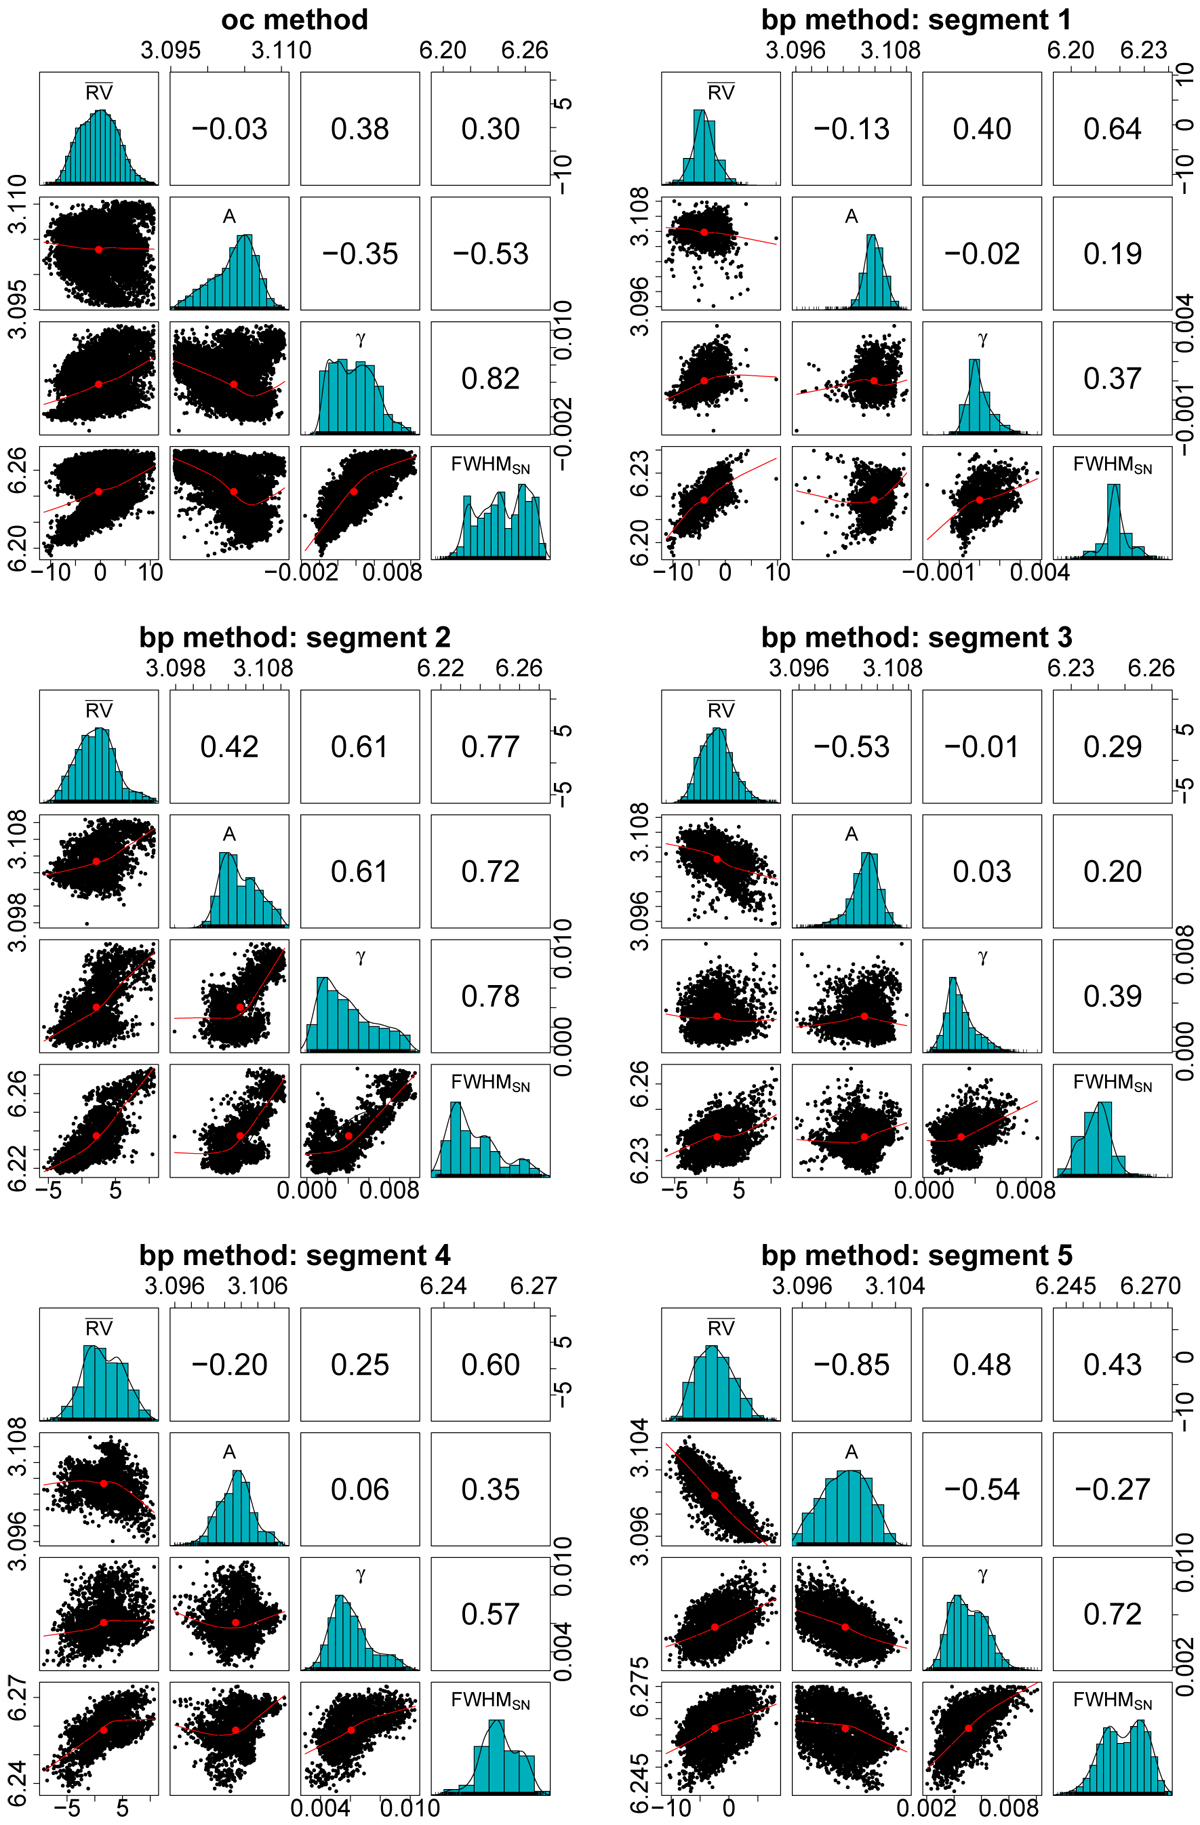
α Cen B: correlation plots between ![]() and the activity indicators (A, γ, and FWHMSN); the contrast parameter A is shown after having been multiplied by a factor ten. Top left panel: the entire data are taken into account as a result of the oc method. Other panels: correlations are shown for each segment found by the bp method. A nonparametric local regression for each pair of considered variables (continuous red line) and its barycenter (i.e., the median, red dot) are also shown.
and the activity indicators (A, γ, and FWHMSN); the contrast parameter A is shown after having been multiplied by a factor ten. Top left panel: the entire data are taken into account as a result of the oc method. Other panels: correlations are shown for each segment found by the bp method. A nonparametric local regression for each pair of considered variables (continuous red line) and its barycenter (i.e., the median, red dot) are also shown.
Current usage metrics show cumulative count of Article Views (full-text article views including HTML views, PDF and ePub downloads, according to the available data) and Abstracts Views on Vision4Press platform.
Data correspond to usage on the plateform after 2015. The current usage metrics is available 48-96 hours after online publication and is updated daily on week days.
Initial download of the metrics may take a while.