Fig. 10
Download original image
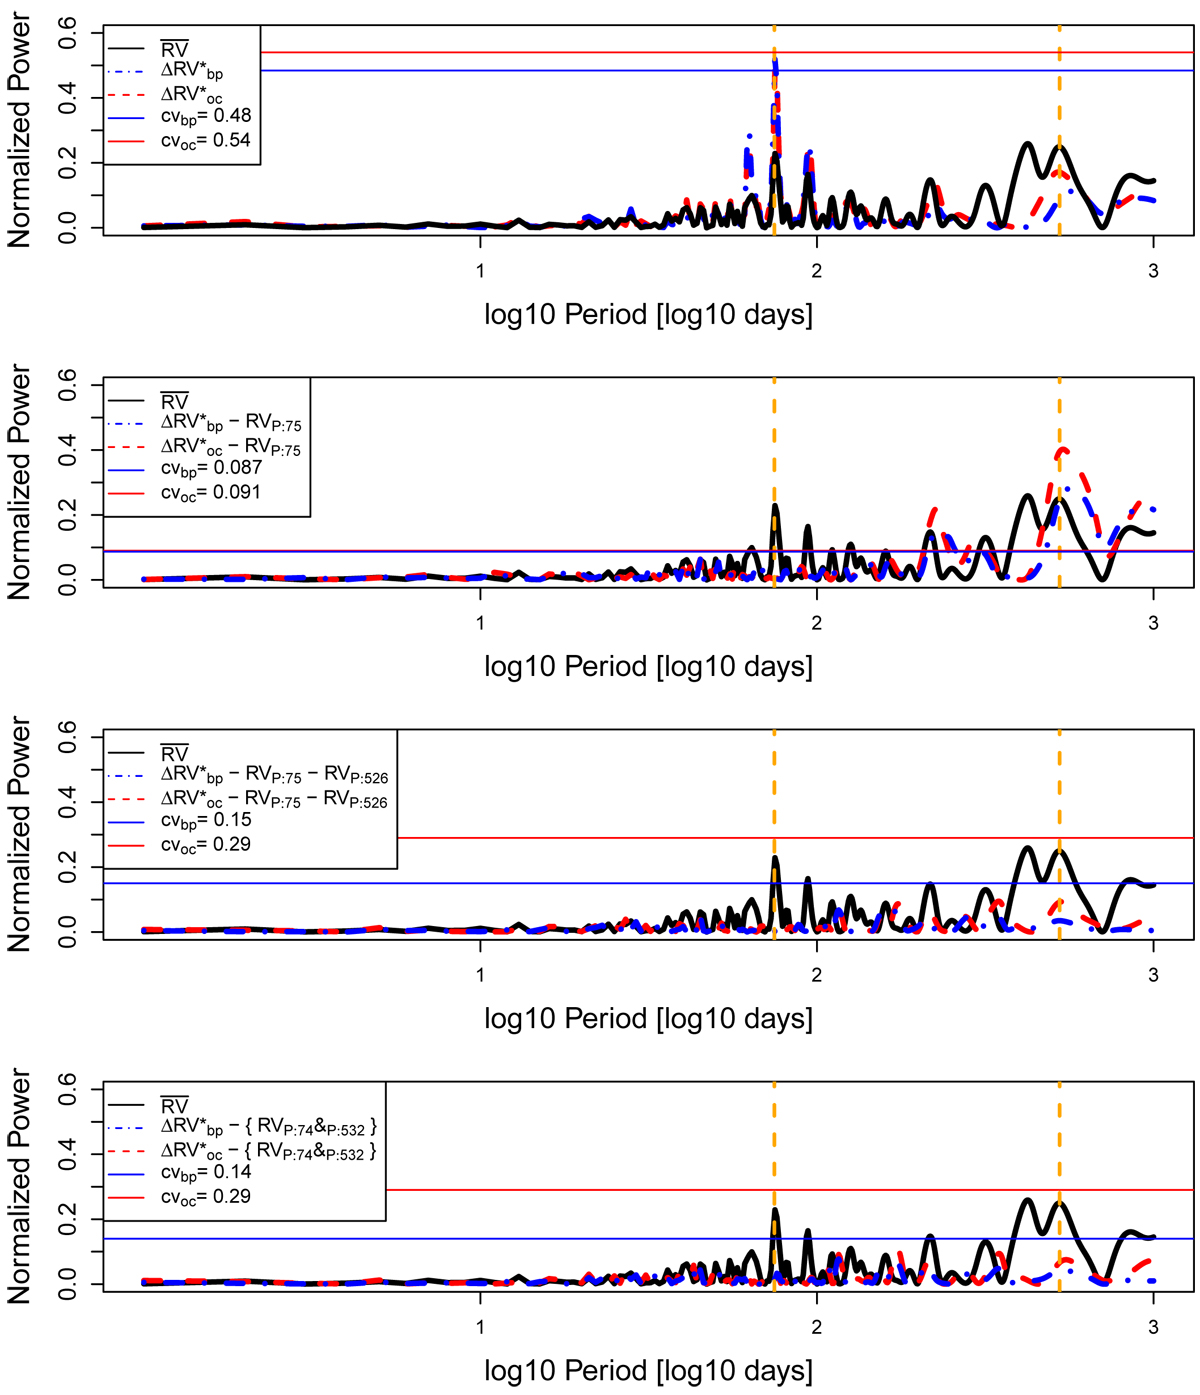
Similar to Fig. 4, but for HD 192310. The vertical dashed orange lines at ~75 days and ~526 days highlight the orbital periods of the two Neptune-mass planets found by Pepe et al. (2011). Top panel: as a result of the stellar activity correction, the bp-peak at ~75 days is above the respective cv value, revealing the planetary signal. Second panel: once the P ~ 75 days planetary signal (RVP:75) is removed from the original time series, another peak corresponding to the P ~ 526 days planetary signal pops up (this time both the bp- and oc-peaks are above the respective cv values). Third panel: after removing also the second planetary signal (RVP:526), the GLS periodogram does not show any other significant peak. Bottom panel: from the activity-corrected RV time series, we subtracted the Keplerian signals of the two planets (RVP:74&P:532) inferred from the global fit of the joint A-MCMC analysis. It turned out that Pb ~ 75 days and Pc ~ 532 days. The main orbital parameters are summarized in Table 8.
Current usage metrics show cumulative count of Article Views (full-text article views including HTML views, PDF and ePub downloads, according to the available data) and Abstracts Views on Vision4Press platform.
Data correspond to usage on the plateform after 2015. The current usage metrics is available 48-96 hours after online publication and is updated daily on week days.
Initial download of the metrics may take a while.