Fig. 9
Download original image
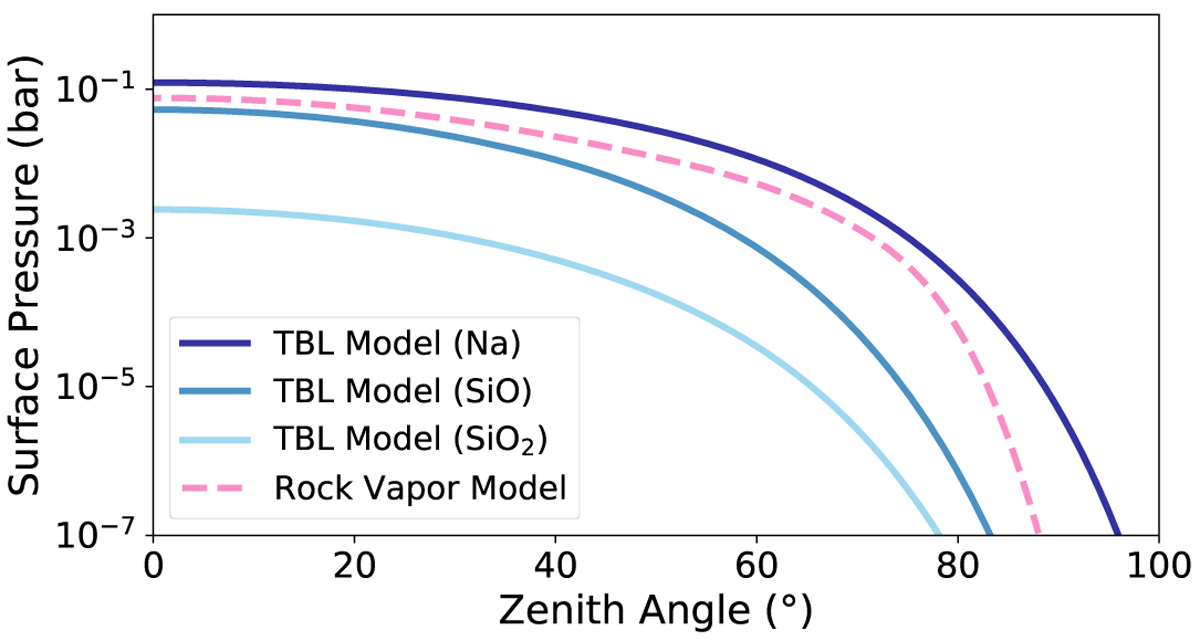
Surface pressure as a function of the zenith angle for the two different models used in this paper. The dashed pink line is based on the pseudo-2D rock vapor model and the blue lines are based on the 1D TBL model for a Na, SiO and SiO2 atmosphere. Although, the TBL models shown in this plot are based on Nguyen et al. (2020) and lack radiative transfer, this would introduce little to no changes to the surface pressure. Na is the most volatile possible component of rock vapor atmosphere, so a pure Na atmosphere has the highest surface pressure (Schaefer & Fegley 2004).
Current usage metrics show cumulative count of Article Views (full-text article views including HTML views, PDF and ePub downloads, according to the available data) and Abstracts Views on Vision4Press platform.
Data correspond to usage on the plateform after 2015. The current usage metrics is available 48-96 hours after online publication and is updated daily on week days.
Initial download of the metrics may take a while.