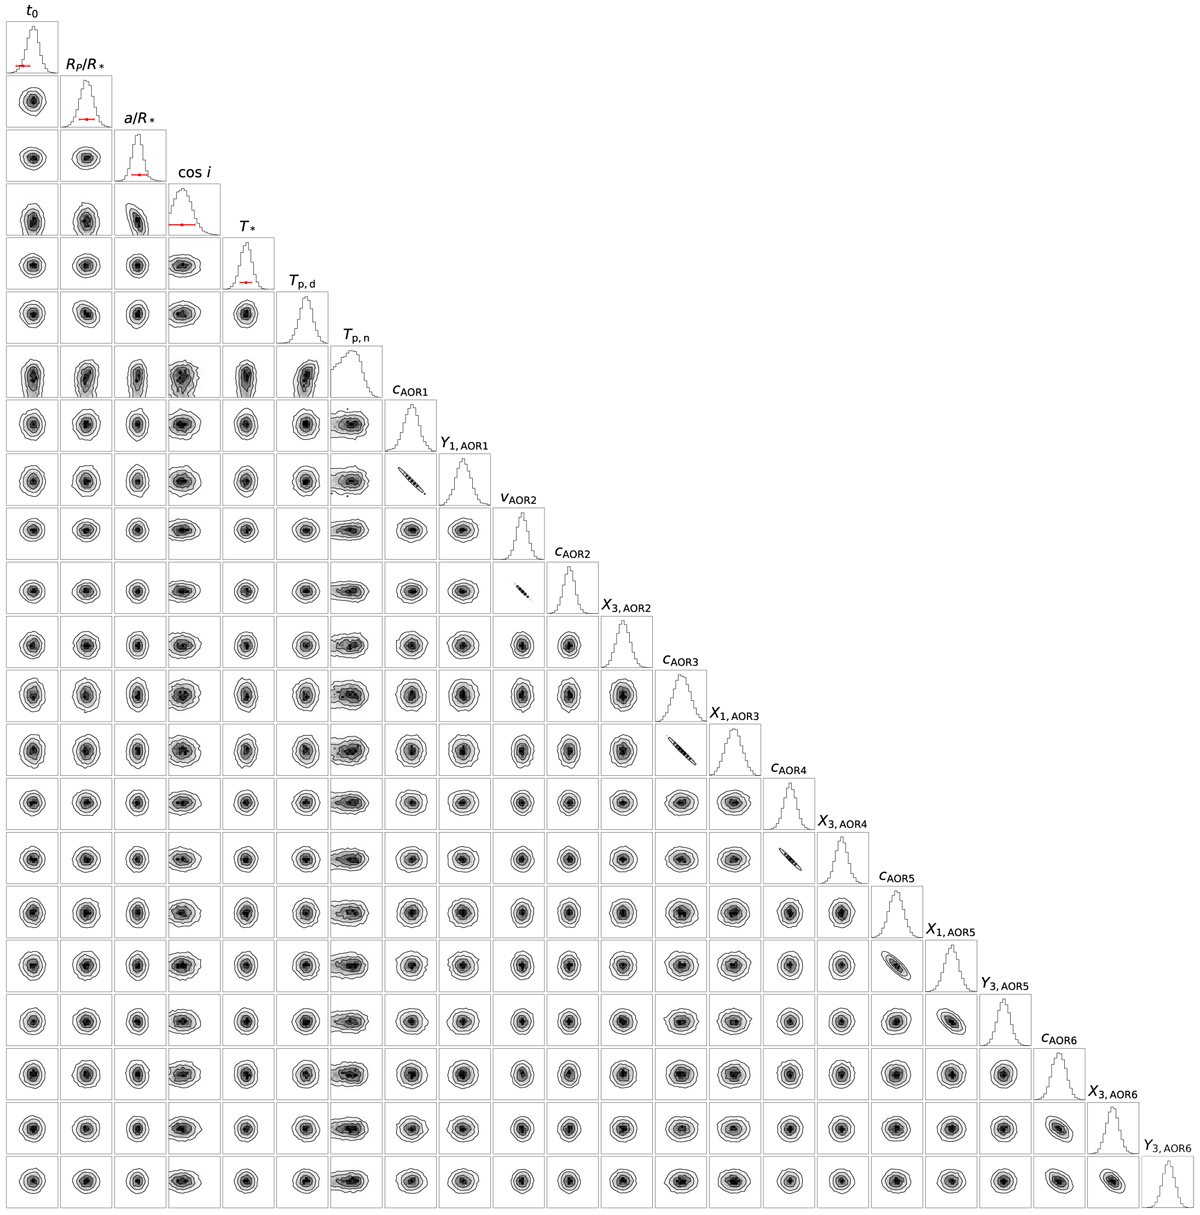
Fig. C.10
Download original image
MCMC corner plot for the two temperature model fit to the Spitzer data. The red bars for t0, Rp/R*, a/R* cos i and T* show the Gaussian priors which were used in this fit. The prior values and the best fit values are listed in Table 4. The resulting values for the systematic parameters are in Table B.4. A list with all fit parameters can be found in Table B.2.
Current usage metrics show cumulative count of Article Views (full-text article views including HTML views, PDF and ePub downloads, according to the available data) and Abstracts Views on Vision4Press platform.
Data correspond to usage on the plateform after 2015. The current usage metrics is available 48-96 hours after online publication and is updated daily on week days.
Initial download of the metrics may take a while.