Fig. C.7
Download original image
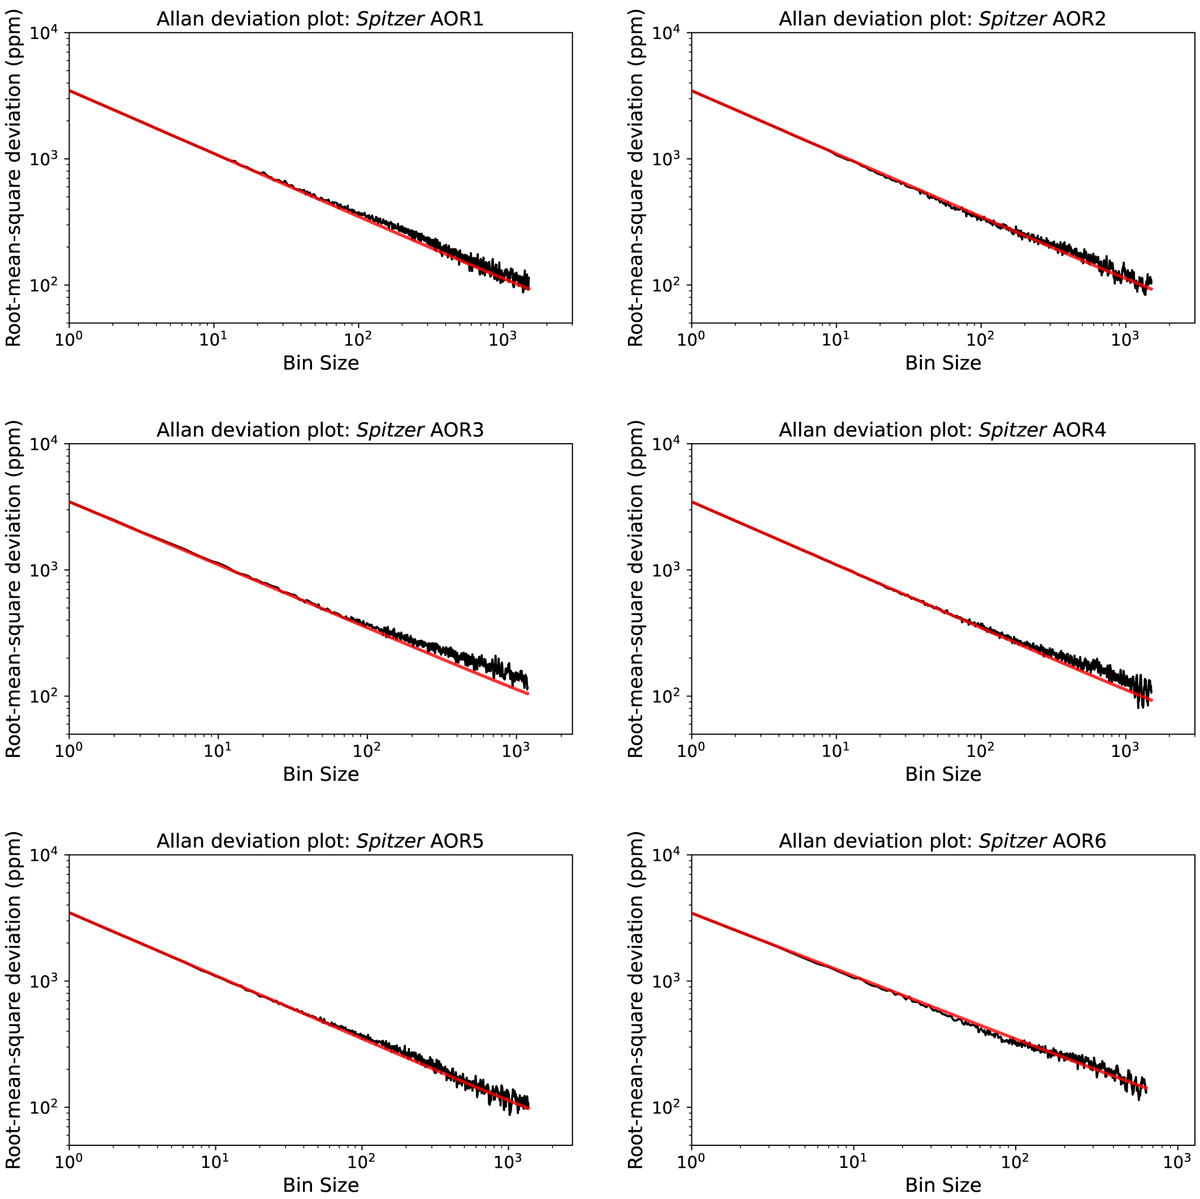
Allan deviation plots for all six Spitzer AORs. The residuals (black curve) are calculated by taking the difference of the full dataset (Spitzer and Kepler) and the Toy model without redistribution fit. A bin size of one depicts no binning at all. The red line shows the expected root-mean-square (rms) for Gaussian noise following the inverse square root law.
Current usage metrics show cumulative count of Article Views (full-text article views including HTML views, PDF and ePub downloads, according to the available data) and Abstracts Views on Vision4Press platform.
Data correspond to usage on the plateform after 2015. The current usage metrics is available 48-96 hours after online publication and is updated daily on week days.
Initial download of the metrics may take a while.