Fig. C.4
Download original image
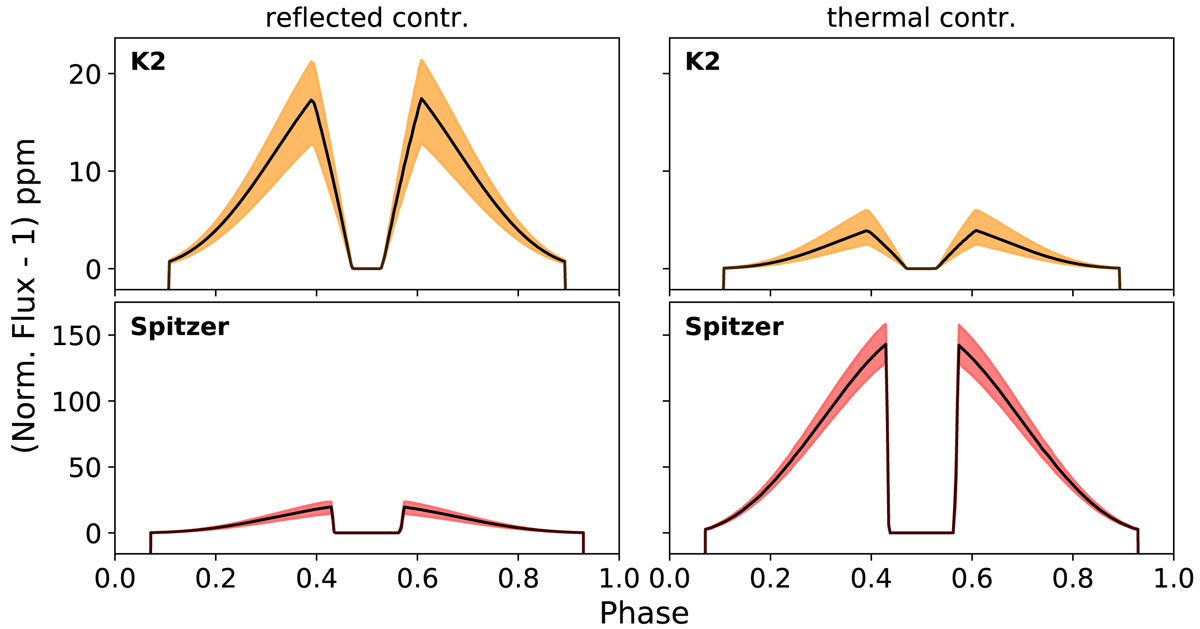
Reflected and thermal contributions to the total flux in the Kepler and Spitzer bandpasses using our best fitting model (toy model without heat redistribution). The shaded areas show the 1σ uncertainties on the best fitting phase curve shape. The K2 phase curves shown here take the longer exposure time into account (30 minutes for K2 Campaign 12) which leads to a less steep ingress and egress at the eclipse.
Current usage metrics show cumulative count of Article Views (full-text article views including HTML views, PDF and ePub downloads, according to the available data) and Abstracts Views on Vision4Press platform.
Data correspond to usage on the plateform after 2015. The current usage metrics is available 48-96 hours after online publication and is updated daily on week days.
Initial download of the metrics may take a while.