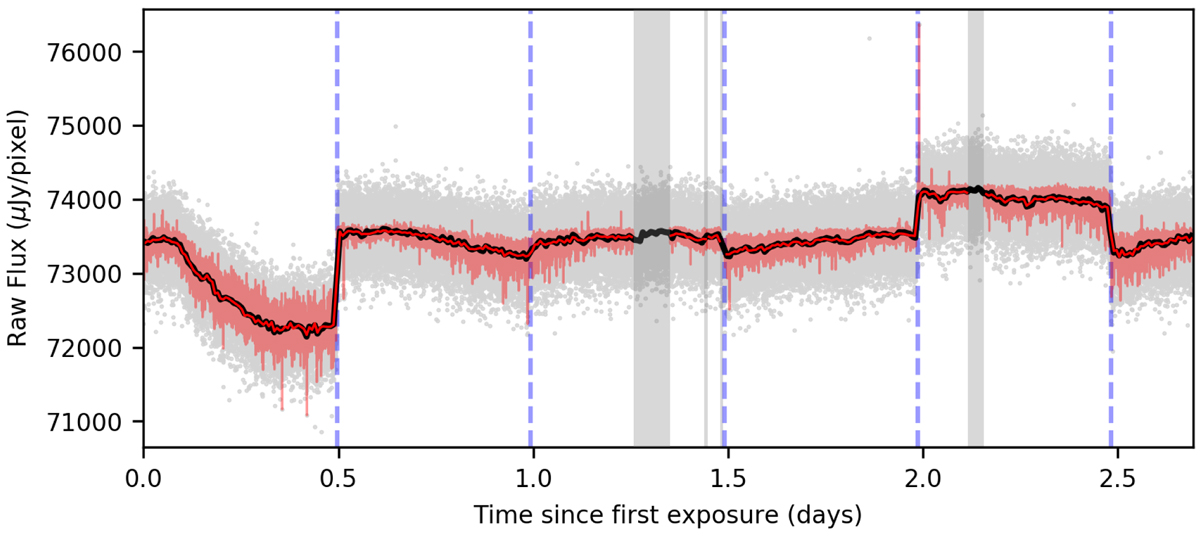
Fig. C.3

Download original image
Raw, unbinned light curve is shown with gray dots with the best fitting model in light red. The vertical, dashed blue lines indicate the start of a new Astronomical Observation Request (AOR). The data in the vertical, gray shaded regions were removed for the fit due to systematic effects. The solid black (red) line shows the raw light curve (best fitting model) binned down to 10 minutes. The planetary signatures (transit, phase curve variation or eclipse) are too weak to be seen in the raw data. For example, the transit depth of K2-141 b is ~425 ppm which leads to a dip of just ~30 µJy/pixel.
Current usage metrics show cumulative count of Article Views (full-text article views including HTML views, PDF and ePub downloads, according to the available data) and Abstracts Views on Vision4Press platform.
Data correspond to usage on the plateform after 2015. The current usage metrics is available 48-96 hours after online publication and is updated daily on week days.
Initial download of the metrics may take a while.


