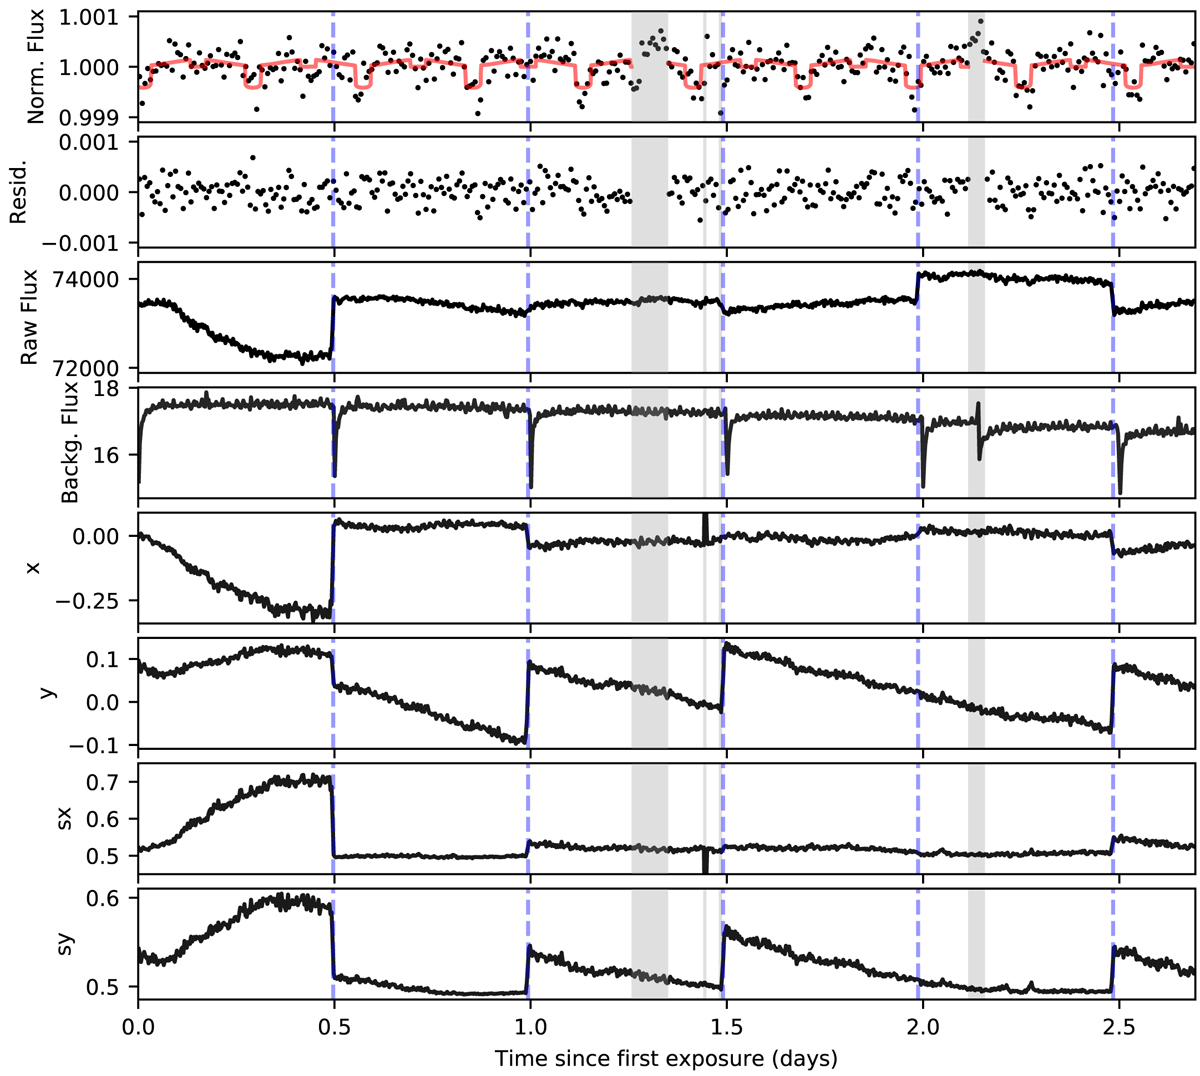
Fig. C.1
Download original image
Diagnostic plot of the full Spitzer observations: The vertical, dashed blue lines indicate the start of a new Astronomical Observation Request (AOR). The data in the vertical, gray shaded regions were removed for the fit due to systematic effects. The red line in the top panel shows the best fit model of the Spitzer data. The difference between the model and the normalized flux can be seen in the panel below. The data has been binned downed to 10 minutes in the top two panels and to 4 minutes in the lower panels. The observed raw flux in µJy/pixel is shown in the third panel. The background flux in the fourth panel is showing changes at the beginning of every AOR as expected due to changes in pointing. An outlier segment in AOR5 which was manually removed from the dataset has been able to be attributed to a strong cosmic ray hit on the detector. The 2D images showing this event can be found in Fig. C.2. The parameters, x and y are the pixel position of the target relative to the “sweet spot”. Finally, sx and sy describe the Gaussian widths of the star’s point spread function.
Current usage metrics show cumulative count of Article Views (full-text article views including HTML views, PDF and ePub downloads, according to the available data) and Abstracts Views on Vision4Press platform.
Data correspond to usage on the plateform after 2015. The current usage metrics is available 48-96 hours after online publication and is updated daily on week days.
Initial download of the metrics may take a while.