Fig. 11
Download original image
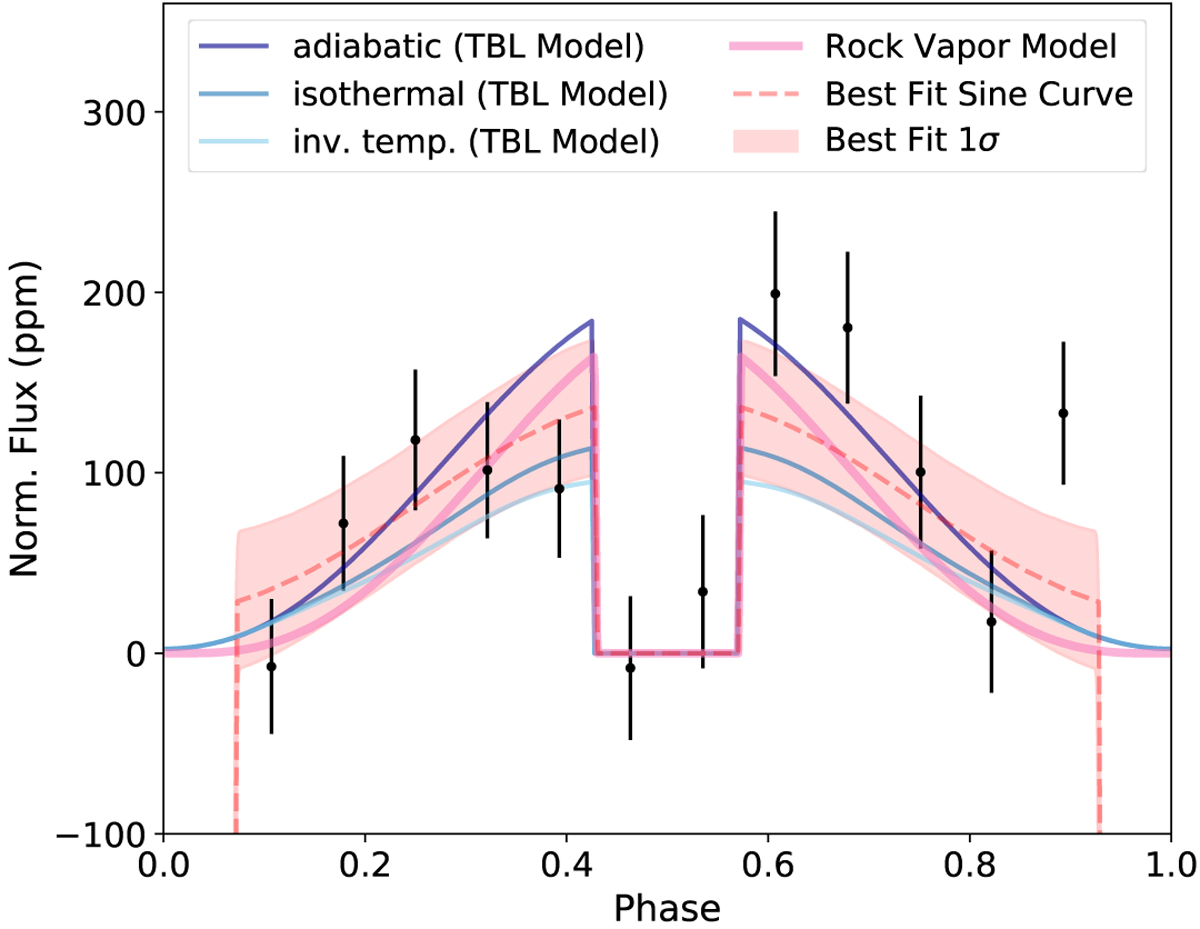
Observed Spitzer phase curve and the best fit sine curve to the Spitzer data (red dashed line with the one sigma uncertainty shaded in red) compared to four theoretical phase curves: the different three blue solid lines are phase curves for the 1D TBL model assuming an adiabatic, an isothermal and an temperature inversion case. We also generated a phase curve out of the pseudo-2D rock vapor model (solid pink line). The adiabatic, isothermal and rock vapor model all fit the observations well and the temperature inversion model provides the worst fit.
Current usage metrics show cumulative count of Article Views (full-text article views including HTML views, PDF and ePub downloads, according to the available data) and Abstracts Views on Vision4Press platform.
Data correspond to usage on the plateform after 2015. The current usage metrics is available 48-96 hours after online publication and is updated daily on week days.
Initial download of the metrics may take a while.