Fig. 7
Download original image
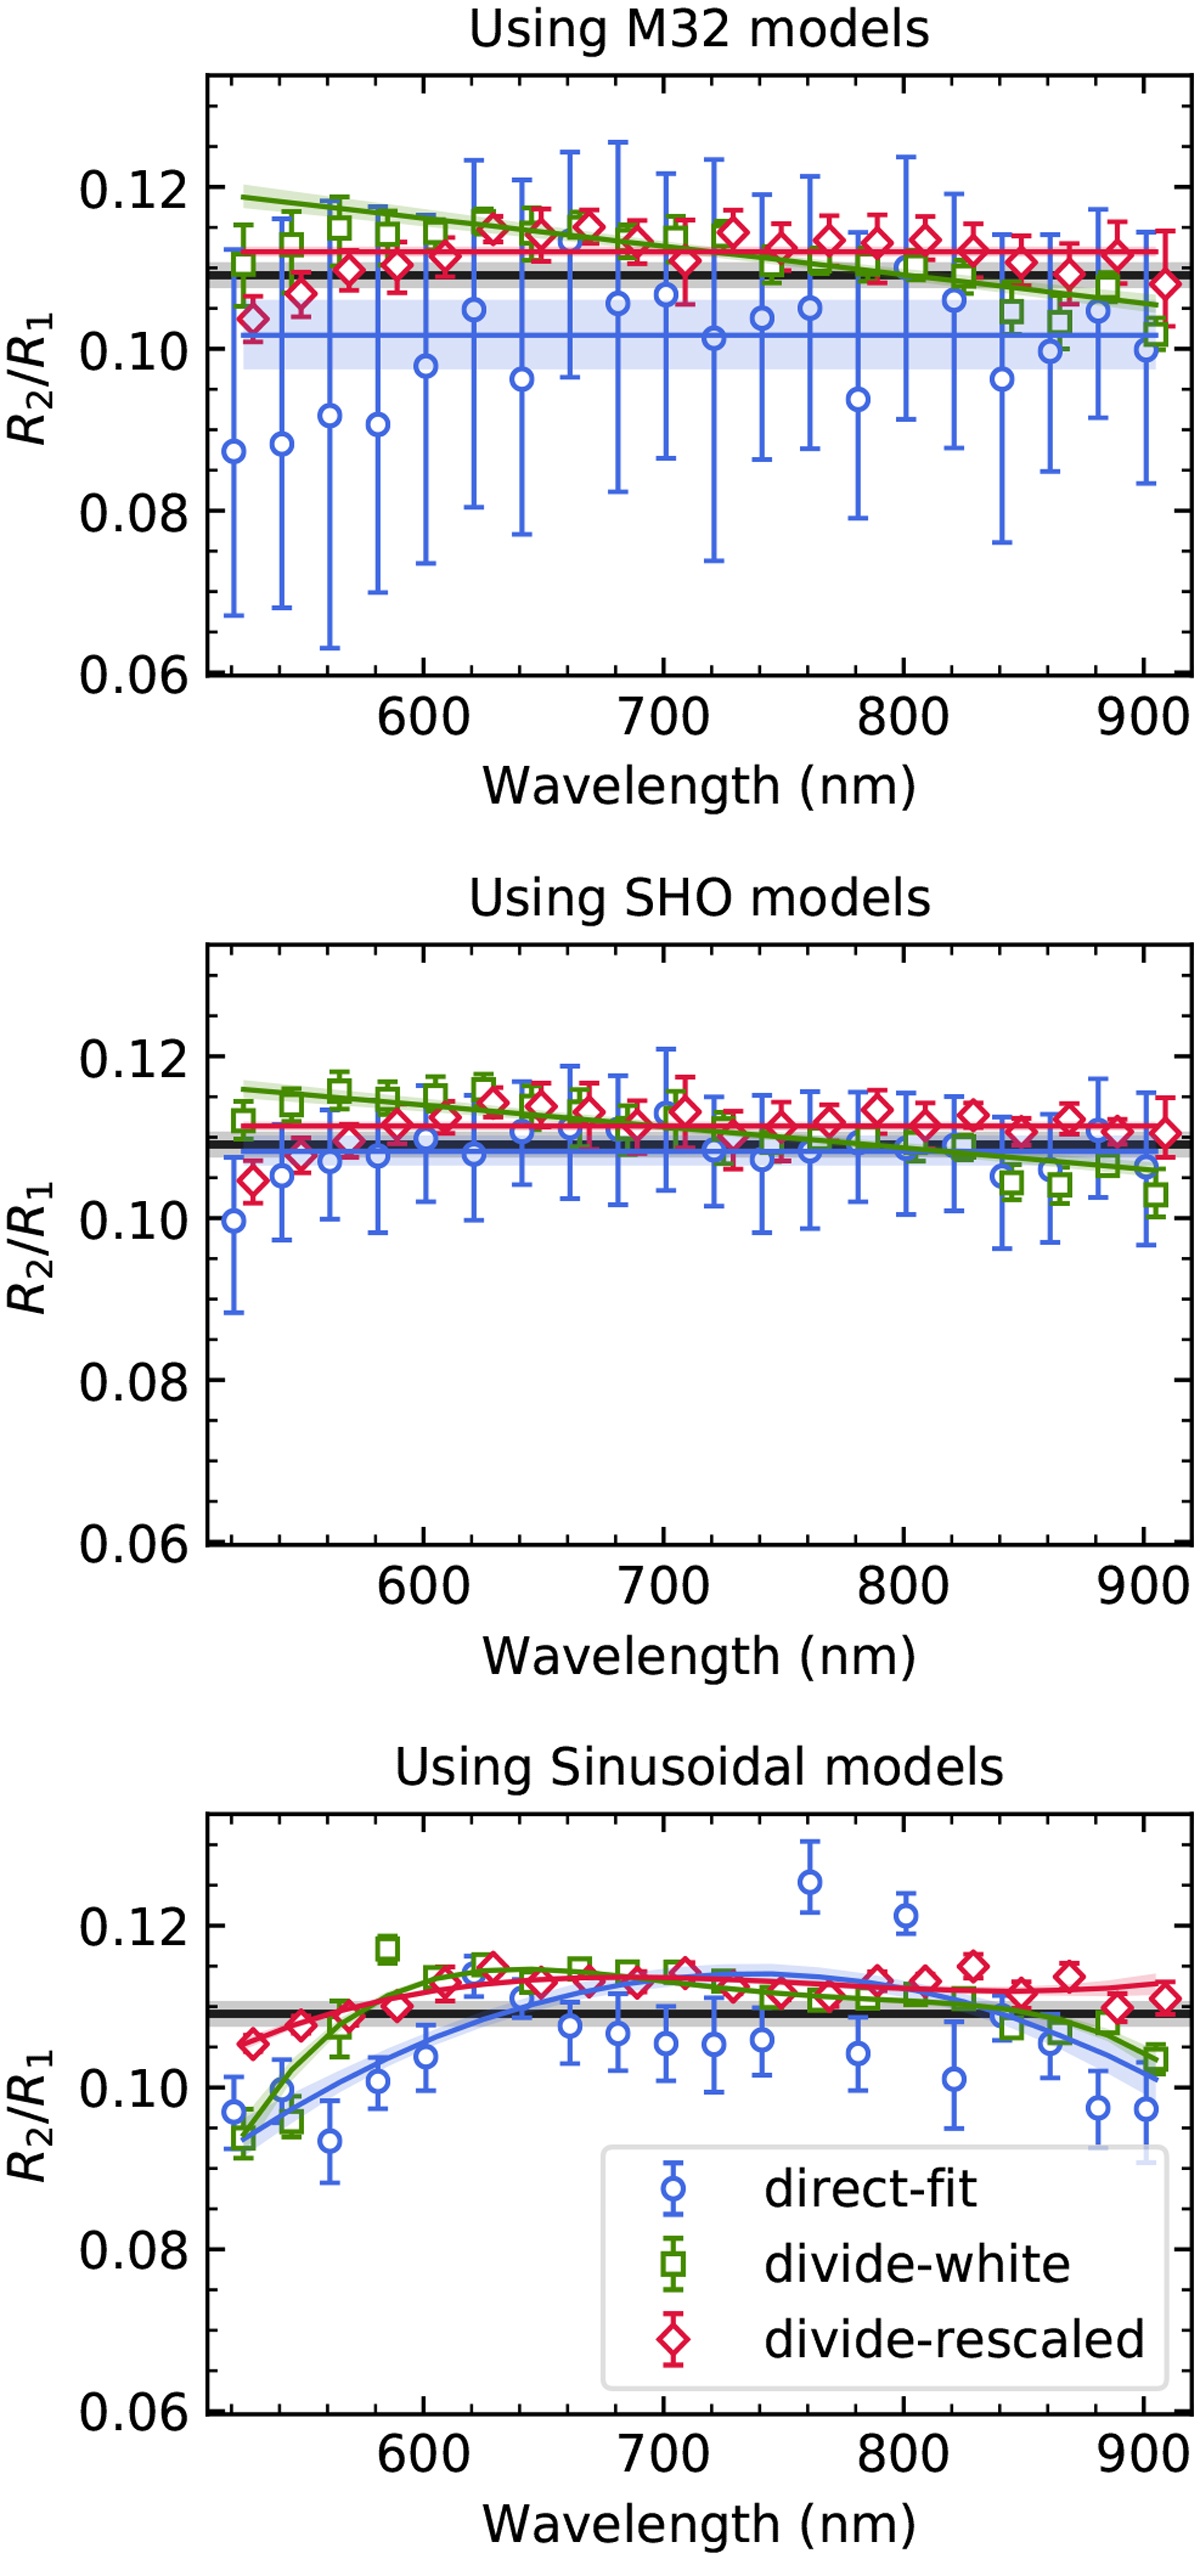
Transmission spectra of KIC 9164561B calculated with different noise models (Top panel: GP-M32 model. Middle panel: GP-SHO model. Bottom panel: sinusoidal baseline model) and different common-mode removal methods (direct-fit: blue circles; divide-white: green squares; divide-rescaled: red diamonds). The solid lines and shaded areas are the best-fit polynomial trends with the strongest Bayesian evidence and their 1σ credible intervals, respectively. The black lines are the broadband radius ratio from the Kepler data. The data points are slightly shifted along the wavelength for clarity.
Current usage metrics show cumulative count of Article Views (full-text article views including HTML views, PDF and ePub downloads, according to the available data) and Abstracts Views on Vision4Press platform.
Data correspond to usage on the plateform after 2015. The current usage metrics is available 48-96 hours after online publication and is updated daily on week days.
Initial download of the metrics may take a while.