Fig. 5
Download original image
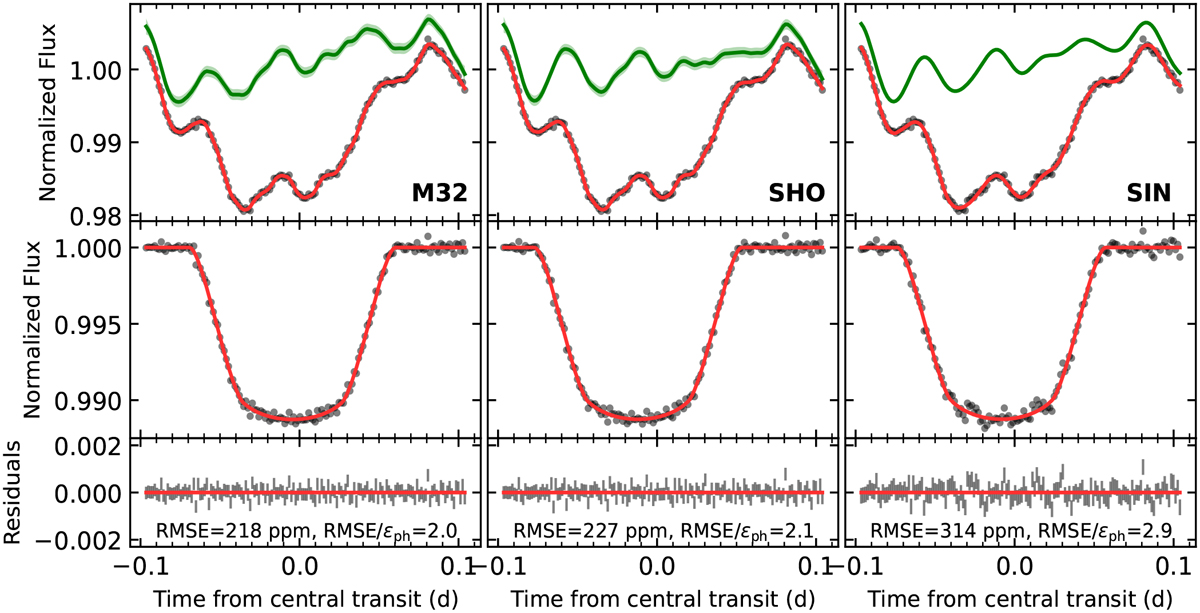
Results of white-light curve fitting for KIC 9164561 using different noise models. Left column: GP-M32 model. Middle column: GP-SHO model. Right column: sinusoidal BF model. Top row: white-light curve (black dots), best-fit model (red), and systematic noise (green). Middle row: detrended light curves (black dots) and transit model (red). Bottom row: residuals. The green shaded intervals indicate the 5cr confidence of the GP models. The GP systematics are shifted to match the light-curve baselines. The systematics exhibit positive offsets due to the ILL and ELV effects.
Current usage metrics show cumulative count of Article Views (full-text article views including HTML views, PDF and ePub downloads, according to the available data) and Abstracts Views on Vision4Press platform.
Data correspond to usage on the plateform after 2015. The current usage metrics is available 48-96 hours after online publication and is updated daily on week days.
Initial download of the metrics may take a while.