Fig. 28
Download original image
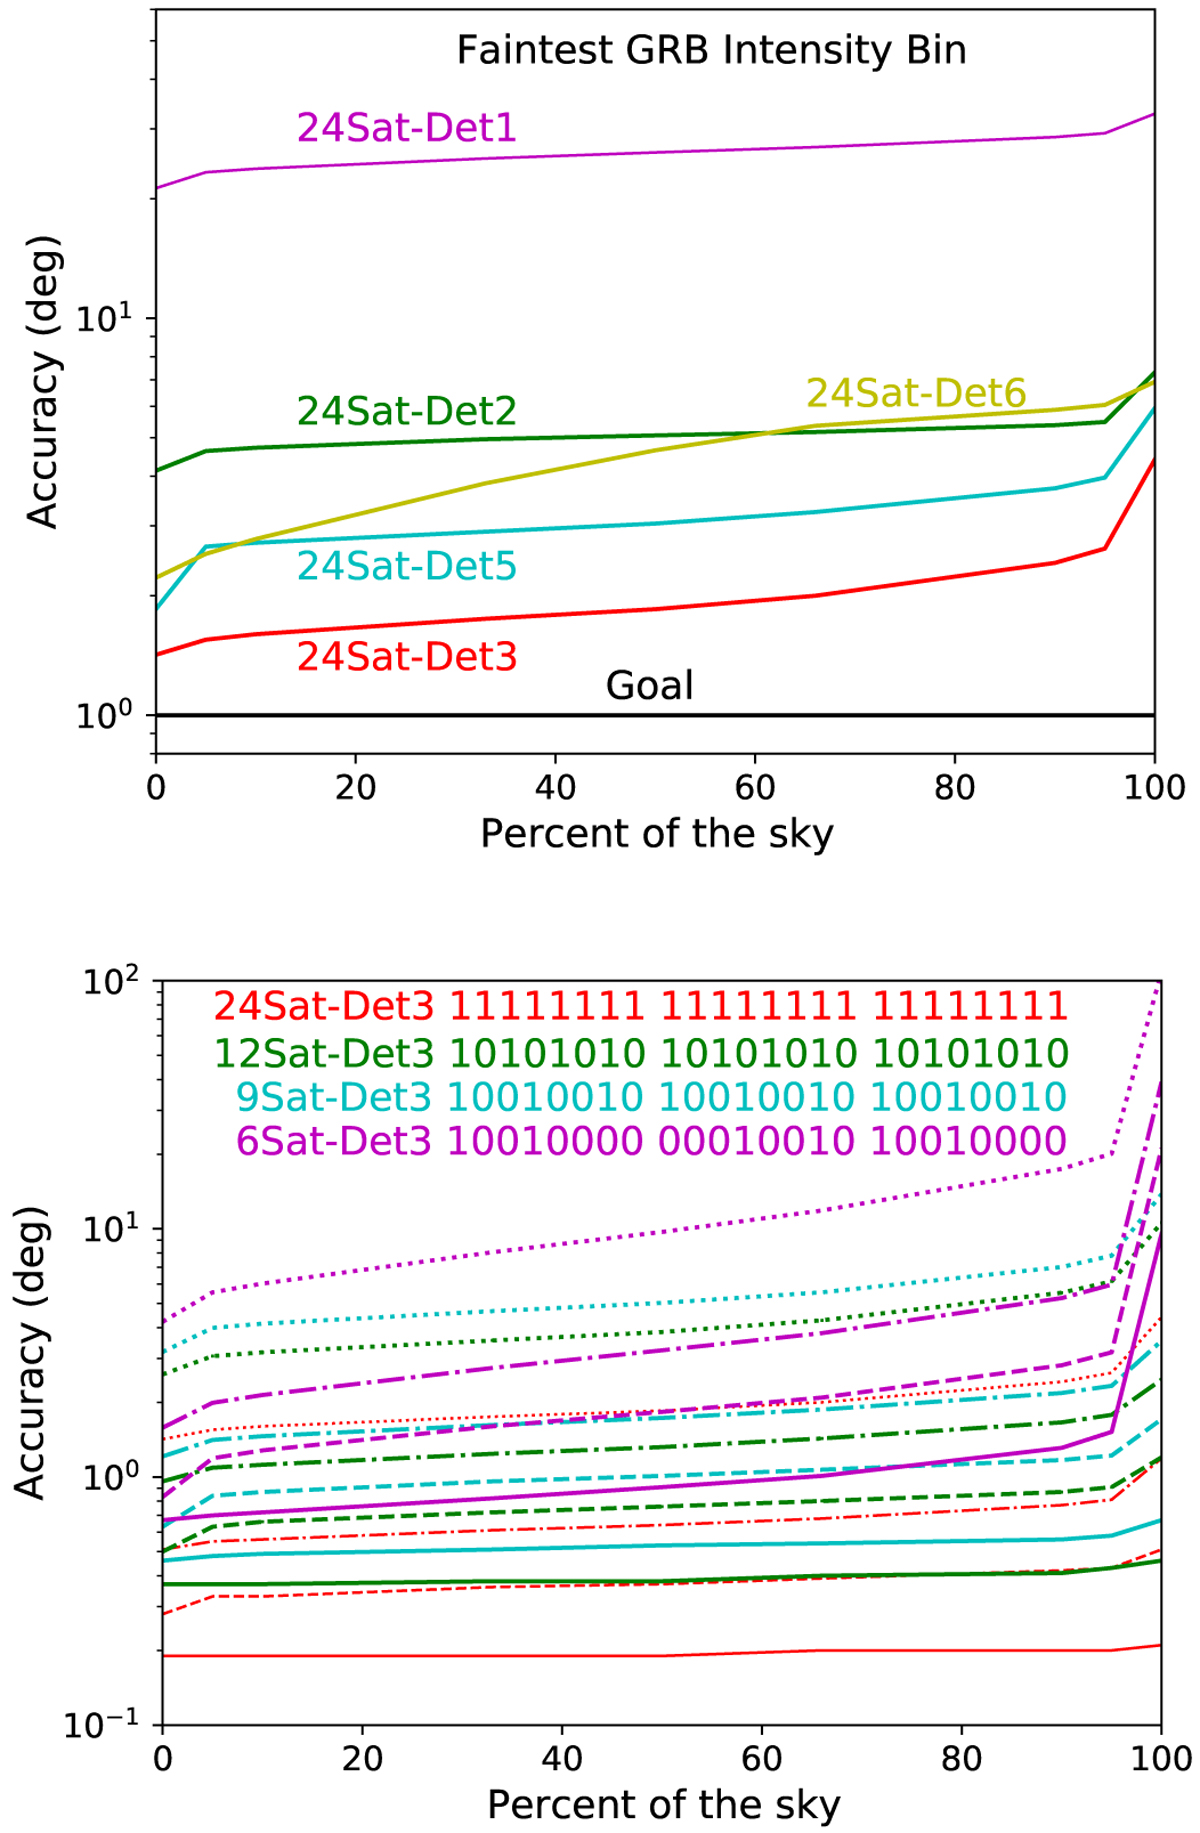
Accuracy of different detector and satellite configurations per sky fraction. Each curve shows the percentage of the sky for which the accuracy is better than the corresponding y-axis in degrees. Top: Faintest intensity bin for the 24-satellite equipment rate; bottom: Each color represents one configuration from Table B.2 for detector 3, with solid lines for the brightest GRB interval and dotted lines for the faintest.
Current usage metrics show cumulative count of Article Views (full-text article views including HTML views, PDF and ePub downloads, according to the available data) and Abstracts Views on Vision4Press platform.
Data correspond to usage on the plateform after 2015. The current usage metrics is available 48-96 hours after online publication and is updated daily on week days.
Initial download of the metrics may take a while.