Fig. 21
Download original image
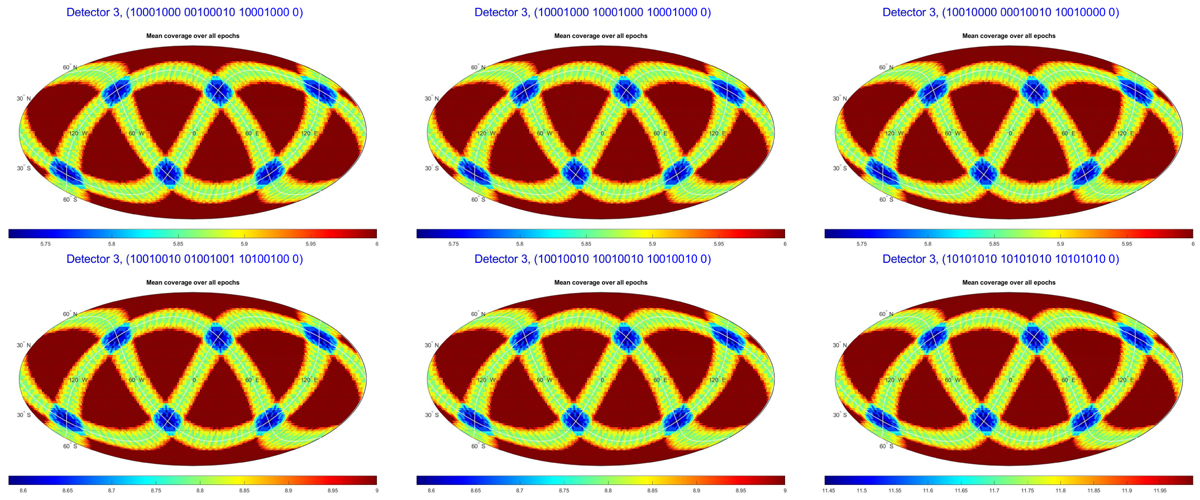
Sky coverage for four-side detectors on 6 (top), 9 (left and middle of bottom row), and 12 (lower right) satellites averaged over one orbit (right). The satellites are distributed differently along each orbital plane, with three different options for the 6 satellites, and two options for 9 satellites. The color-coding provides the number of satellites that see a given GRB at a given time, averaged over one orbital period.
Current usage metrics show cumulative count of Article Views (full-text article views including HTML views, PDF and ePub downloads, according to the available data) and Abstracts Views on Vision4Press platform.
Data correspond to usage on the plateform after 2015. The current usage metrics is available 48-96 hours after online publication and is updated daily on week days.
Initial download of the metrics may take a while.