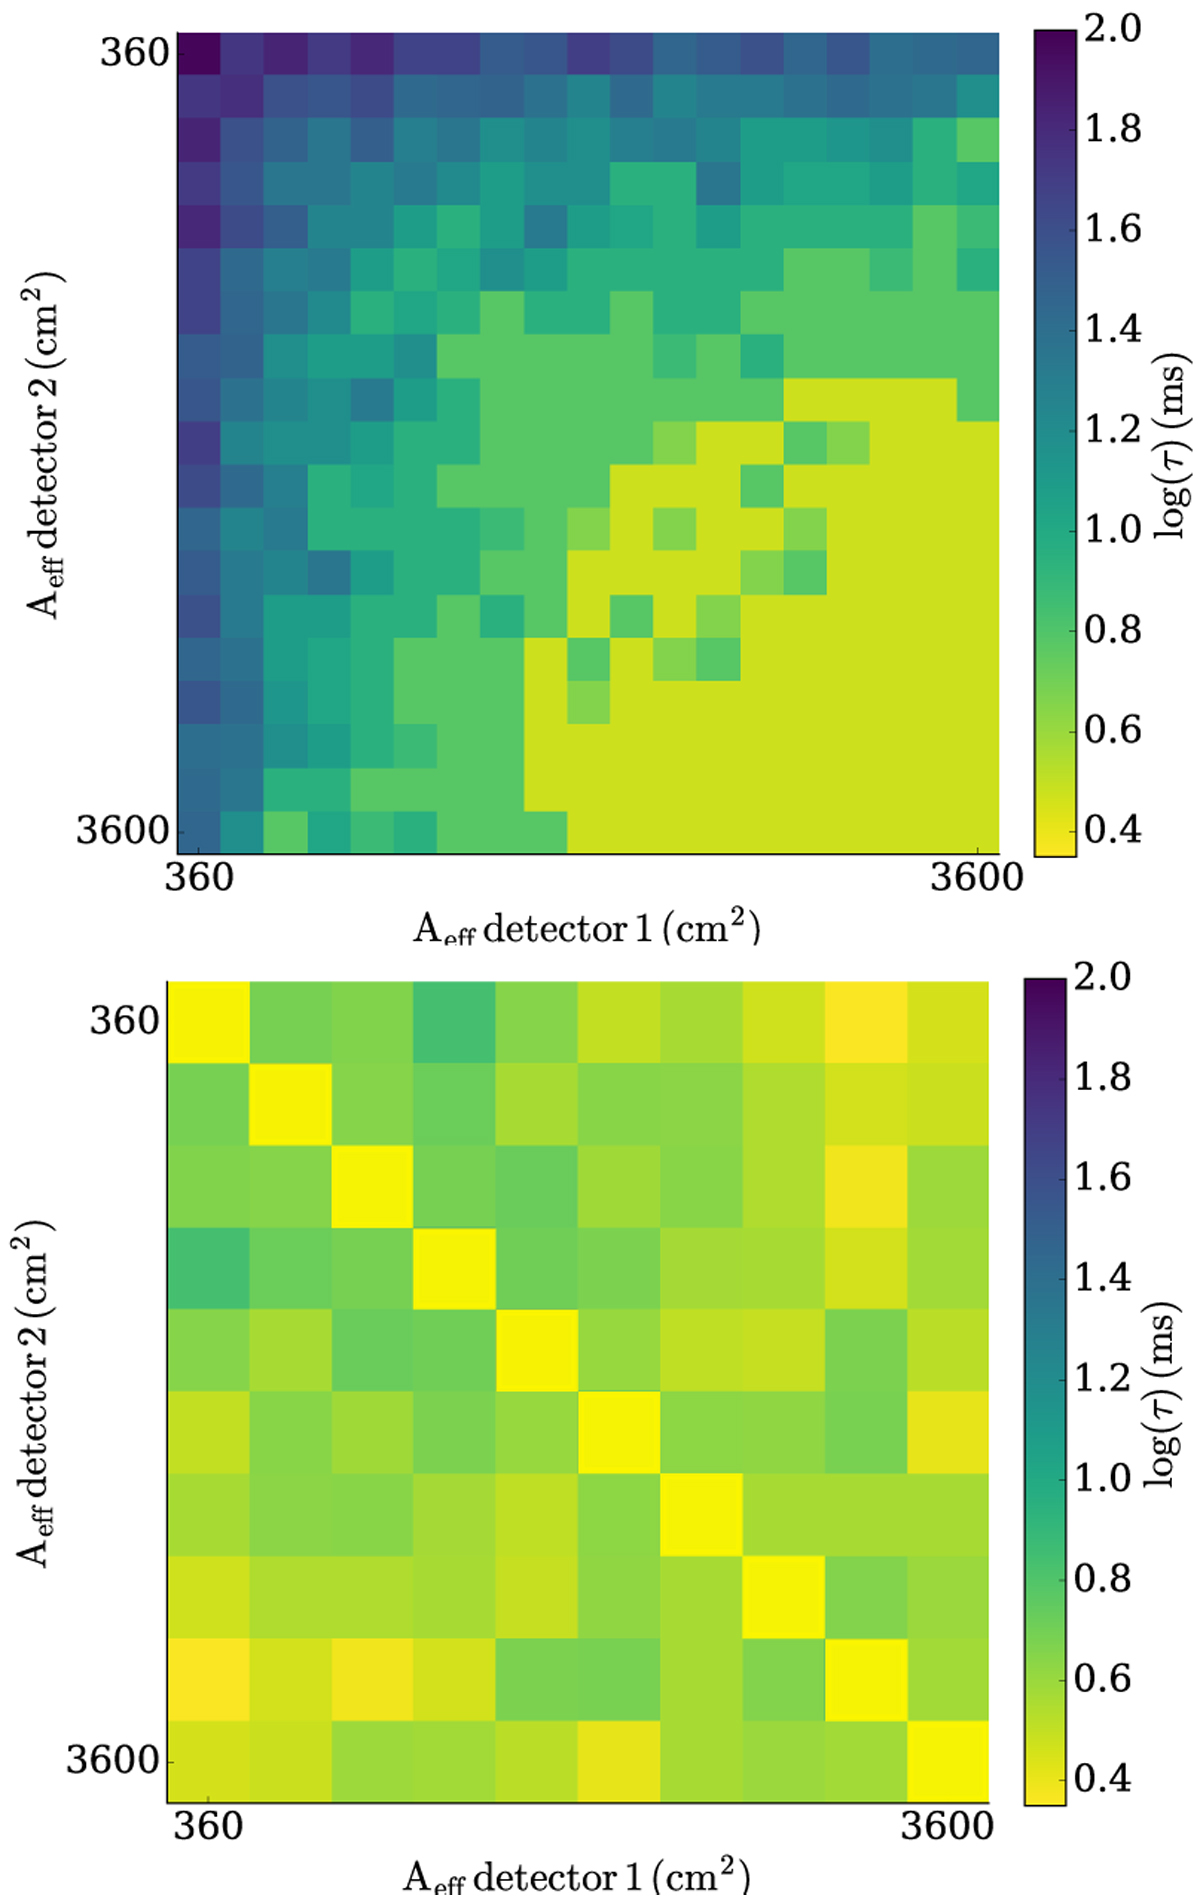
Fig. 12
Download original image
Distribution of the error of the time-delay (color-coded) for different angles of two detectors (x- and y-axis) at the same position (=satellite). This means the nominal time delay should be zero. The matrices shown are the median of all simulated GRBs in the bright fluence bin (#4 in Table 3), separately computed for the classical cross-correlation method (top) and the forward-folding nazgul method (bottom), and separate matrices for the other intensity bins. For identical effective areas, i.e., the diagonal, nazgul recovers the nominal time delay of zero, so it was set to 0.3 to avoid division by zero in the follow-up steps. The placement on the same satellite also mimics (along the diagonal) the net effect on the accuracy of two identical detectors on different satellites facing exactly toward the same sky location. Each pixel is the median of the time-delay of many different GRB light curves. The time resolution of the detector is assumed to be 3 ms. The effective area distribution mimics a 1D detector with 3600 cm2 seen at different off-axis angles.
Current usage metrics show cumulative count of Article Views (full-text article views including HTML views, PDF and ePub downloads, according to the available data) and Abstracts Views on Vision4Press platform.
Data correspond to usage on the plateform after 2015. The current usage metrics is available 48-96 hours after online publication and is updated daily on week days.
Initial download of the metrics may take a while.