Fig. 10
Download original image
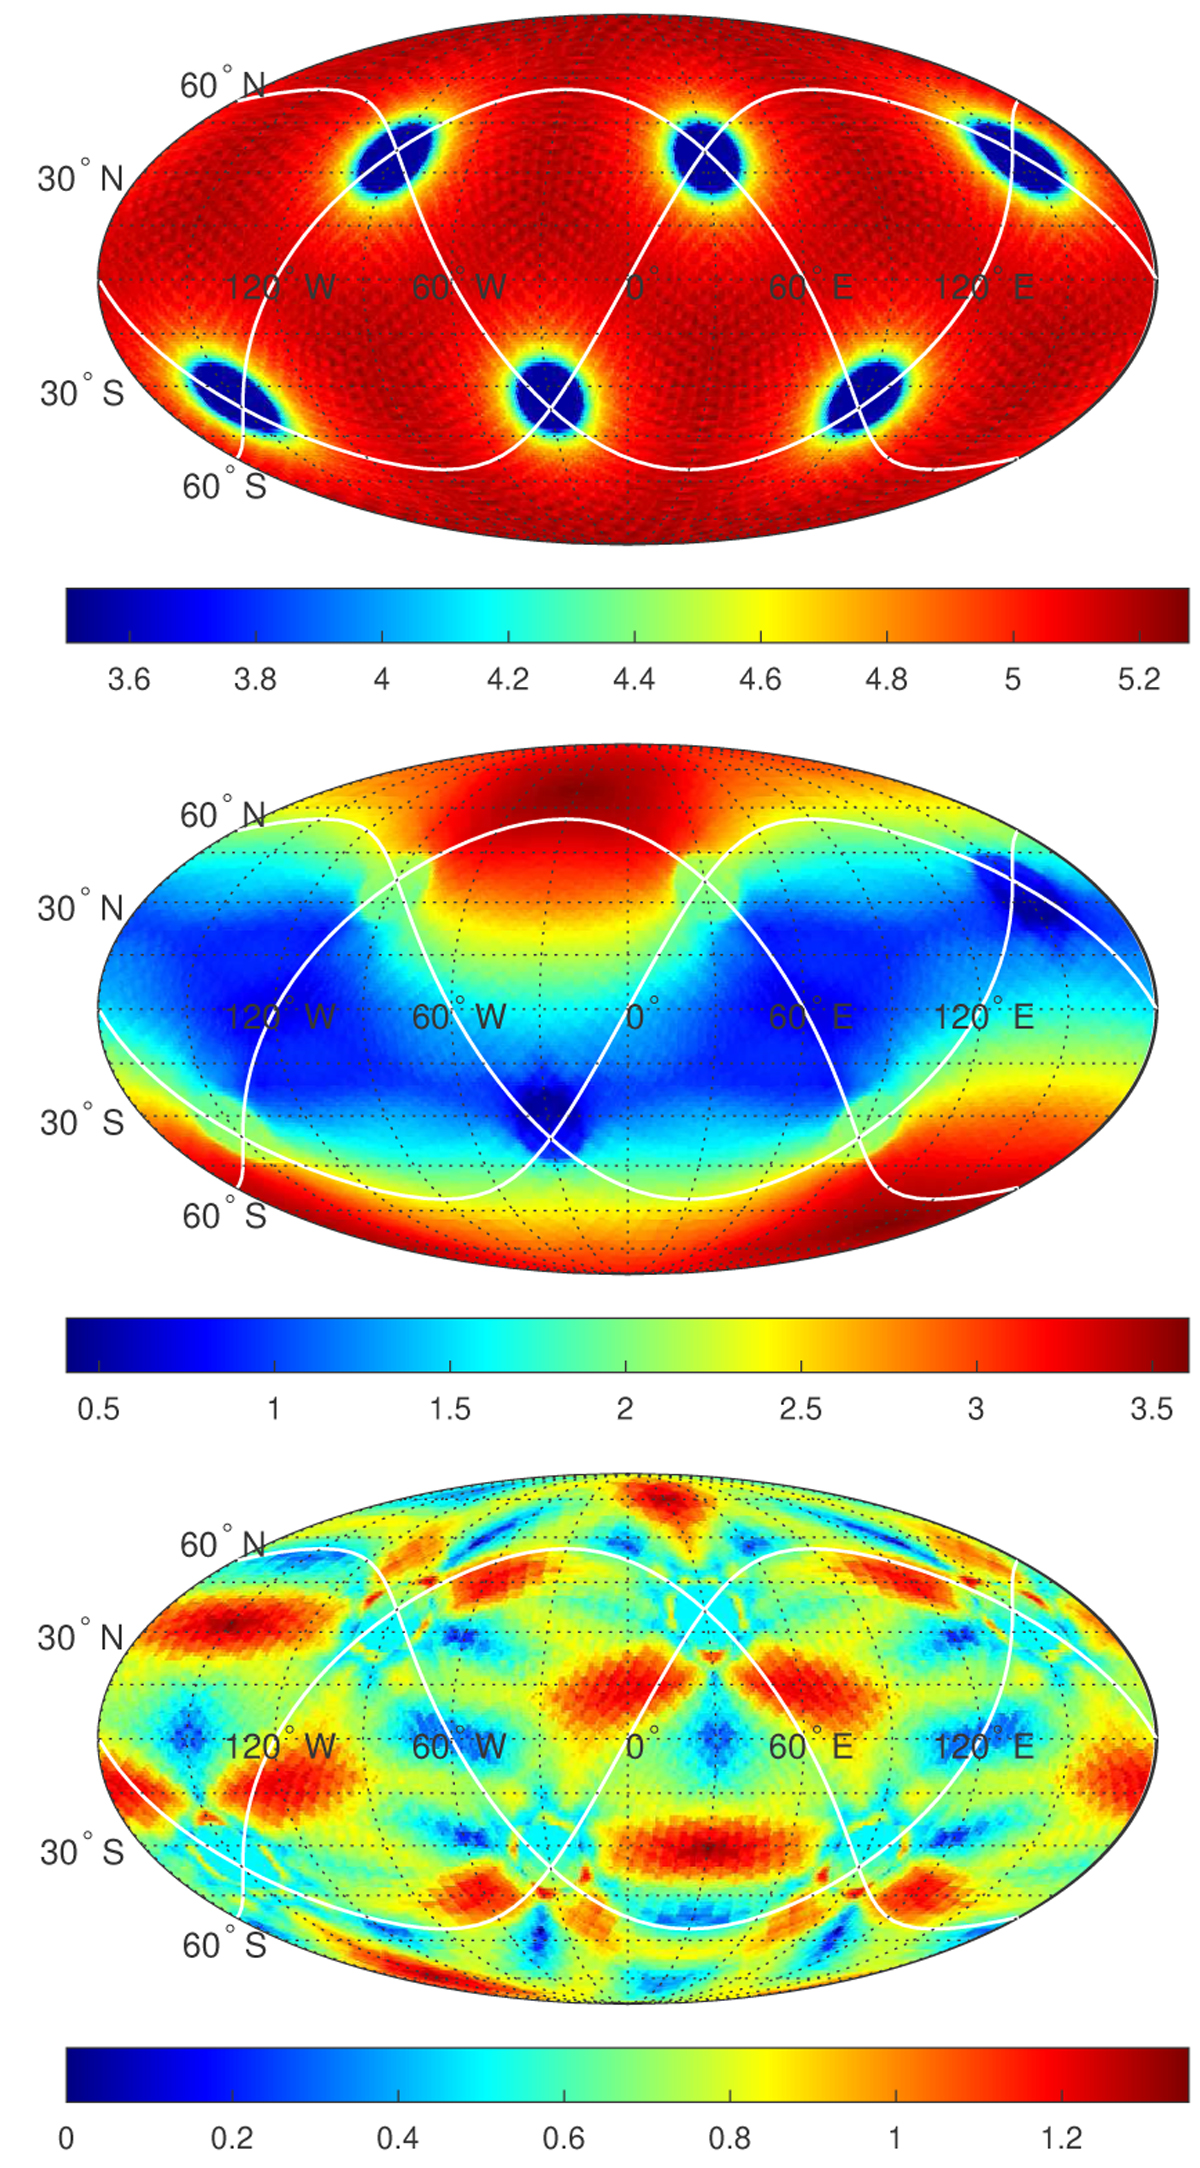
Extreme example of the influence of the distribution of GRB detectors over the orbital plane top: identical mean sky coverage, ranging between 3.5 and ~5.3; middle: all 12 detectors distributed over one pole; and bottom: all 12 detectors equally distributed. The lower two panels show the standard deviation for each point on the sky.
Current usage metrics show cumulative count of Article Views (full-text article views including HTML views, PDF and ePub downloads, according to the available data) and Abstracts Views on Vision4Press platform.
Data correspond to usage on the plateform after 2015. The current usage metrics is available 48-96 hours after online publication and is updated daily on week days.
Initial download of the metrics may take a while.