Fig. 9
Download original image
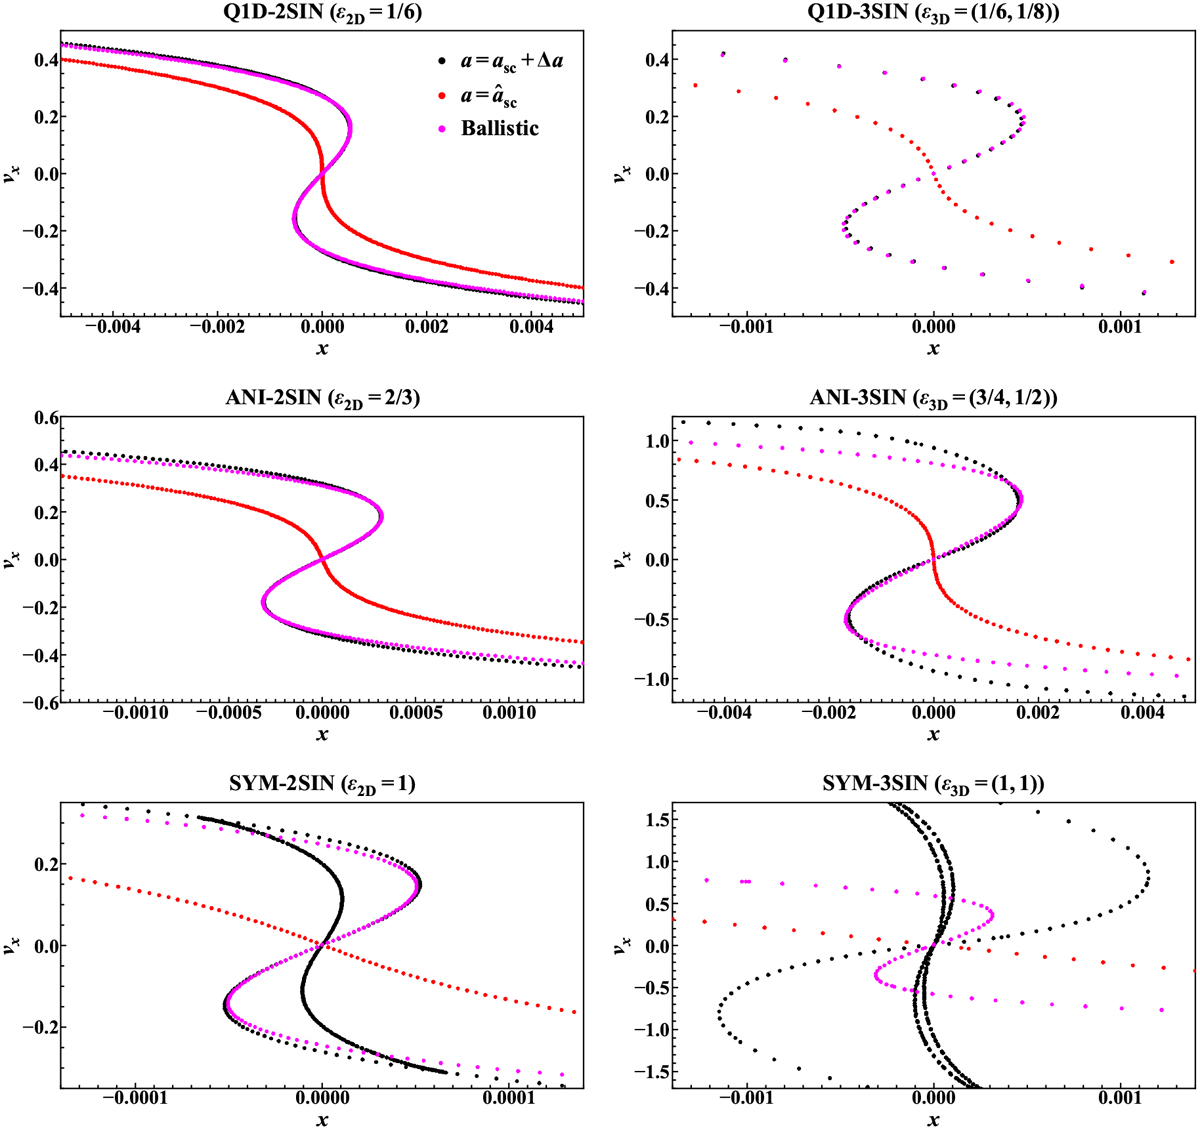
Tests of the ballistic approximation in Vlasov simulations: measured phase-space structure for two-and three-sine-wave initial conditions. This figure is analogous to Fig. 2, except that it shows a zoomed-in view of the central part of the system shortly after collapse. We test the validity of the ballistic approximation by using two simulation snapshots slightly before (red curves, with ![]() as shown in Table 1 except for ϵ3D = (1,1), for which a = 0.03103) and slightly after the collapse time (black, with a = asc + Δa). The ballistic approximation, as described in the main text, is applied to the red curves to obtain the magenta ones, to be compared directly with the exact solution, in black, given by the simulation.
as shown in Table 1 except for ϵ3D = (1,1), for which a = 0.03103) and slightly after the collapse time (black, with a = asc + Δa). The ballistic approximation, as described in the main text, is applied to the red curves to obtain the magenta ones, to be compared directly with the exact solution, in black, given by the simulation.
Current usage metrics show cumulative count of Article Views (full-text article views including HTML views, PDF and ePub downloads, according to the available data) and Abstracts Views on Vision4Press platform.
Data correspond to usage on the plateform after 2015. The current usage metrics is available 48-96 hours after online publication and is updated daily on week days.
Initial download of the metrics may take a while.