Fig. 7
Download original image
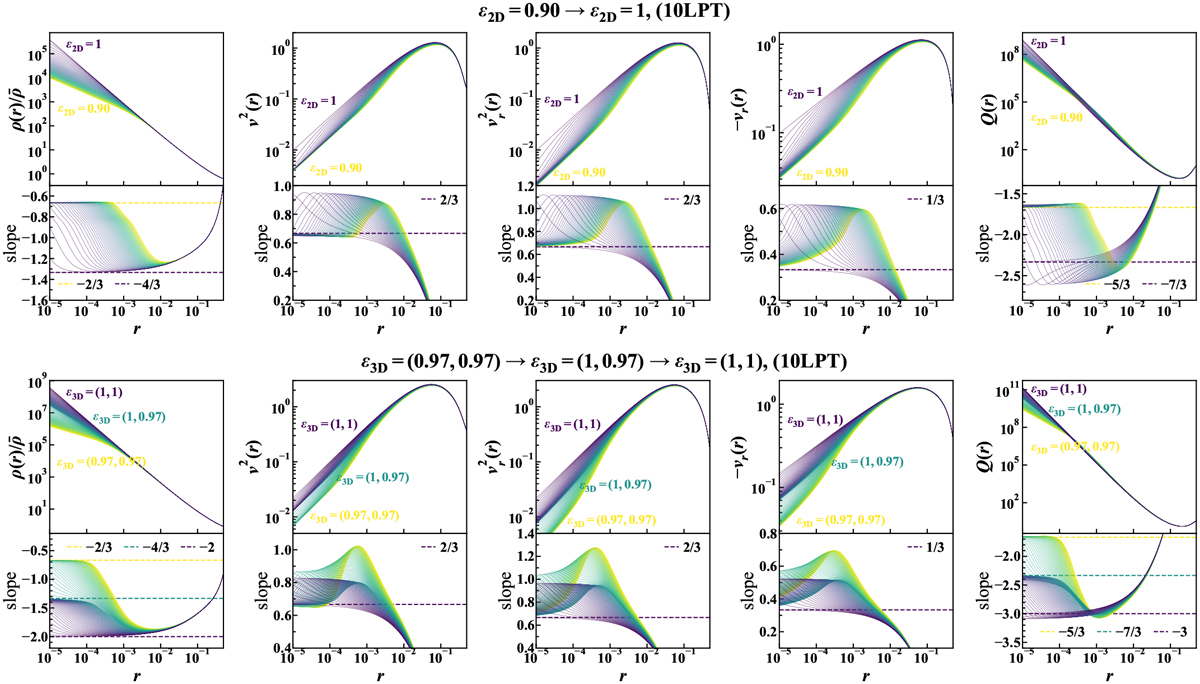
Radial profiles at the shell-crossing using tenth-order LPT in the vicinity of ![]() (top panels) and
(top panels) and ![]() (bottom panels). In the top panels, ϵ2D is progressively varying in the range [0.9,1] with linear intervals of Δϵ = 0.1/64. In the bottom panels, ϵ3D progressively changes from (0.97,0.97) to (1,1) with linear intervals of Δϵ = 0.03/64. From left to right, we present radial profiles of the normalised density
(bottom panels). In the top panels, ϵ2D is progressively varying in the range [0.9,1] with linear intervals of Δϵ = 0.1/64. In the bottom panels, ϵ3D progressively changes from (0.97,0.97) to (1,1) with linear intervals of Δϵ = 0.03/64. From left to right, we present radial profiles of the normalised density ![]() , the velocity dispersion υ2, the radial velocity dispersion
, the velocity dispersion υ2, the radial velocity dispersion ![]() the infall velocity –υr, and the pseudo phase-space density Q, respectively. In the lower inserts corresponding to logarithmic slopes, the horizontal dashed lines correspond to the values expected from singularity theory as computed in Appendix D and listed in Table 2.
the infall velocity –υr, and the pseudo phase-space density Q, respectively. In the lower inserts corresponding to logarithmic slopes, the horizontal dashed lines correspond to the values expected from singularity theory as computed in Appendix D and listed in Table 2.
Current usage metrics show cumulative count of Article Views (full-text article views including HTML views, PDF and ePub downloads, according to the available data) and Abstracts Views on Vision4Press platform.
Data correspond to usage on the plateform after 2015. The current usage metrics is available 48-96 hours after online publication and is updated daily on week days.
Initial download of the metrics may take a while.