Fig. 3
Download original image
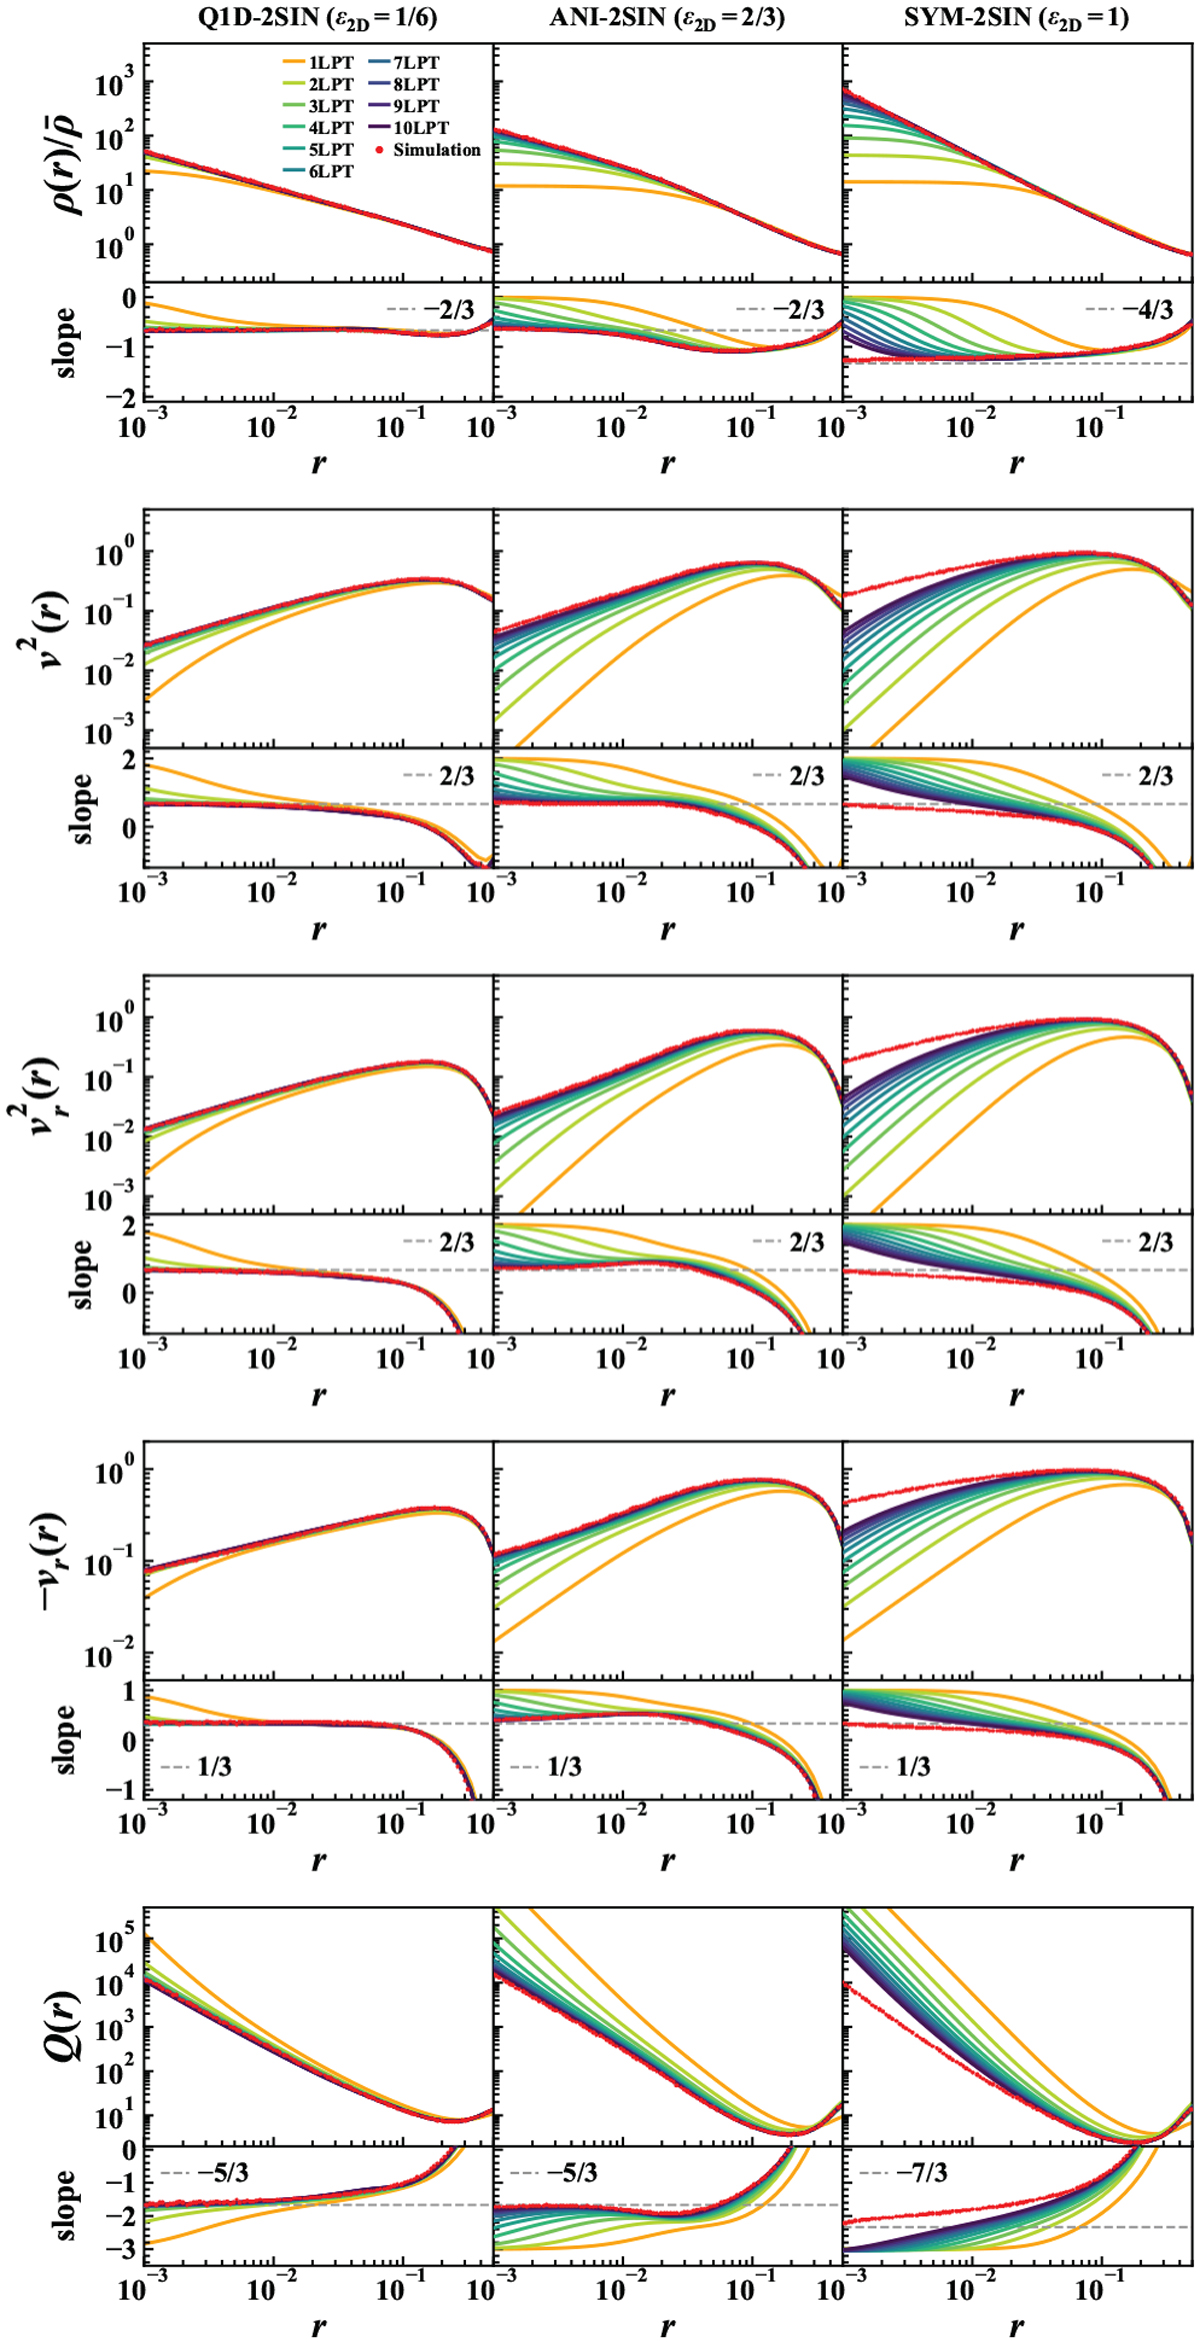
Radial profiles and their logarithmic slopes for the two-sine-wave initial conditions at the shell-crossing time. As indicated in top-left panel, LPT predictions are given by solid lines of various colours and Vlasov simulations results are represented by red dots. From left to right, the initial conditions are given by Q1D-2SIN (ϵ2D = 1/6), ANI-2SIN (ϵ2D = 2/3), and SYM-2SIN (ϵ2D = 1), respectively. From top to bottom, we present the radial profiles of the normalised density ![]() , the velocity dispersion υ2, the radial velocity dispersion
, the velocity dispersion υ2, the radial velocity dispersion ![]() , the infall velocity -υr, and the pseudo phase-space density Q(r), respectively. We note that when plotting the logarithmic slopes in Vlasov simulations, we used the Savitzky-Golay filter implemented in savgol_filter of SciPy (Virtanen et al. 2020) to smooth the data for presentation purposes. In the logarithmic slope panels, the horizontal dashed lines correspond to the theoretical predictions at the small radii of Appendix D, as listed in Table 2.
, the infall velocity -υr, and the pseudo phase-space density Q(r), respectively. We note that when plotting the logarithmic slopes in Vlasov simulations, we used the Savitzky-Golay filter implemented in savgol_filter of SciPy (Virtanen et al. 2020) to smooth the data for presentation purposes. In the logarithmic slope panels, the horizontal dashed lines correspond to the theoretical predictions at the small radii of Appendix D, as listed in Table 2.
Current usage metrics show cumulative count of Article Views (full-text article views including HTML views, PDF and ePub downloads, according to the available data) and Abstracts Views on Vision4Press platform.
Data correspond to usage on the plateform after 2015. The current usage metrics is available 48-96 hours after online publication and is updated daily on week days.
Initial download of the metrics may take a while.